What is the default amplitude of the voltage output from the generator in the x-over design tool?
Can I change the amplitude? I'd like to set the voltage to 2.83 Vrms.
Generator signal is fixed 1.0 to maintain measured voltage sensitivity from drivers' response data to SPL, Power and Directivity charts, without scaling with Scaling text box in Drivers tab or Active Buffer(s) in the schematic. So, recommended scaling of measurement data is dB/2.83V/1m in order to get standard readings instantly to graphs. If measurement data is something else, you can use Scaling text boxes in Drivers tab or pre-processing to change it. Or whatever you like.
Power dissipation window has output signal adjustment in Volts or Power to nominal flat 8/4 Ohms. That way generator signal 1.0 is "invisible" while calculating power dissipation by node voltages and resistances.
when i select "1 pair" i can't choose "parallel" only "series"
I can concur...
I've tried to explain this in three places; tooltips, changelog and user manual:
Connection of each isobaric pair is selected with 'series' checkbox just below 'Isobaric' checkbox. If 'series' checkbox is not checked, connection is parallel.
Each isobaric pair is handled as a single driver in the simulation. If you have more than one isobaric pair, you can select with radio buttons on the right how these pairs are connected to each others: series, parallel, 2||2.. or 3||3.. Maximum is 12 isobaric pairs i.e. 24 drivers. All eight (8) connection options are available if you have six (6) isobaric pairs.
Few images would be helpful for sure.
Few images would be helpful for sure.
Easiest cases with six isobaric pairs. Isobaric checkbox is checked.
'series' checkbox not checked and 'Series' radio button selected:
An externally hosted image should be here but it was not working when we last tested it.
'series' checkbox checked and 'Parallel' radio button selected:
An externally hosted image should be here but it was not working when we last tested it.
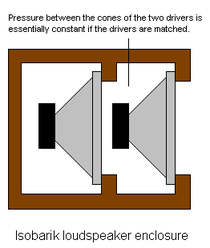
^ Isobaric pair should have zero pressure between drivers. But as far as I understand, the first picture has drivers pumping the interdriver airspace.
This pic is from wikipedia
About isobaric in principle, what is the real benefit of it nowdays, with cheap power and pretty linear magnet/coil motors?
This pic is from wikipedia
About isobaric in principle, what is the real benefit of it nowdays, with cheap power and pretty linear magnet/coil motors?
Last edited:
I guess you mean zero change in pressure. I agree. Both drivers move together in the same direction to the same extent. So, the pressure between drivers should not change.^ Isobaric pair should have zero pressure between drivers. But as far as I understand, the first picture has drivers pumping the interdriver airspace.
I tested again and you are right. Checking 1 pair isobaric is treated as parallel, Vb and Re is halved. The main reason for choosing Isobaric is Fb reduction. There is a huge advantage to this as it saves space, and if there is one thing many people don't like these days are big loudspeakers. I see a clear advantage when it comes to subwoofer and 4-way loudspeakers, or even a small 3-way or nice extension for a 2-way.^ Isobaric pair should have zero pressure between drivers. But as far as I understand, the first picture has drivers pumping the interdriver airspace.
This pic is from wikipedia
About isobaric in principle, what is the real benefit of it nowdays, with cheap power and pretty linear magnet/coil motors?
Generator signal is fixed 1.0 to maintain....
1.0 Vrms? Or peak to peak? Or zero to peak? Or something else?
1.0 Vrms? Or peak to peak? Or zero to peak? Or something else?
As already wrote, 1.0 is basically just gain which transfers level of drivers' measurement data to SPL charts as unchanged unless level is adjusted manually with Scaling text box or manipulated by filter or buffer stages in crossover.
If signal of the generator would be something else, program needs to know what voltage and distance was used while measurements or assume e.g. 2.83V and 1m in order to calculate SPL to the charts with some logic.
Power dissipation window plays with absolute Vrms as well as Enclosure tool. These are extra reasons why main program should have just gain=1.0 to avoid messing up with double voltages.
Snapshot/overlay feature tries to play this role. Overlays are also loadable from files.... a "Hold" feature...
I checked this feature. It's very useful, it's a must-have for comparisons. However, it doesn't replace the "Hold" feature. As far as I can see, I can only load an overlay from a file; I can't freeze the current plot as an overlay.
ARTA and LIMP have a "set as overlay" feature like the XSim "Hold" button. What I need is to freeze the current graph(s) with a "Hold" button, and then go ahead and change xo component values, and see how the graph deviates from the frozen plot. If I have to do this using the current "Load reference graph" feature, I'll have to export the current graph first into a file and then load it. This makes it very hard to use.
And for what it's worth, I feel there's need for at least 2-3 simultaneous frozen plots, not just one. ARTA and XSim give me just one.
Last edited:
I agree with you totally. In addition, I feel that the raw data in this case, at a conceptual level, inside the data structures which are the core of any program, is point-based. It's not vector data. What the graphs are depicting is, if one may put it that way, a simulation of a line. It's internally a series of points data. Regular shapes, like lines and elliptical curves etc are vector by their innate nature, and most vector drawing languages support these as primitives. The graphs we are dealing with here are based on mathematical computation which aren't supported by any vector drawing language or notation. Therefore, to present an SPL curve as vector data, your program will have to take the completely unpredictable plot of several hundred points and then present them as several hundred line segments joining the dots.Vector graphics export as .svg xml would be very nice. I'm not arguing against that. Disappointment is that it needs separate functions and extra programming work. I can investigate possibilities to grab and convert graphics commands to xml.
This seems like an "artificial" demand to place on your software; like asking it to jump through hoops to please an audience. If someone has such a bad need to change colours of lines, they can take the FRD and play with the data points in Excel, IMHO. Really sorry, but I don't see how getting vector export of inherently irregular data-points helps us design better xo.
I can only load an overlay from a file; I can't freeze the current plot as an overlay.
'Take snapshot' command saves main curve(s) to overlay memory. See user manual for more information how each chart acts.
Whole XO design can be stored with S button and recalled with R button but that's quite different story.
Oh. Ok thanks a lot. Will check. This will really take care of what I'm asking.'Take snapshot' command saves main curve(s) to overlay memory. See user manual for more information how each chart acts.
Yes, I've seen these buttons, and they're a really cool feature.Whole XO design can be stored with S button and recalled with R button but that's quite different story.
I don't see how getting vector export of inherently irregular data-points helps us design better xo.
It does not. But it does help with getting the figures to look like one might want them to look. Ever thought of using the graphics for a paper or similar document, that would have to be compatible with black-and-white printing (change everything to B/W and use dashed/dotted/dash-dotted line styles so one can tell them apart)? Or use a particular font? Or need to be scaled to a certain aspect ratio? Things like that can't be done cleanly with bitmap graphics. But, as I already said, it's always possible to export the raw data to an ASCII file and load this to a plotting software that can do what's needed. I am doing just that.
^Shortly about vector graphics. Looks that other than contour lines of directivity polarmap would be possible to convert to svg-xml. Drawing of contour lines is graphical bitmap operation at the moment so svg-xml would have multiple small dots instead of paths which would look pixels (not so good).
Conversion to svg-xml would be quite nice exercise, but not so sure about usefulness if 1 of 2000 users needs that feature.
Conversion to svg-xml would be quite nice exercise, but not so sure about usefulness if 1 of 2000 users needs that feature.
Conversion to svg-xml would be quite nice exercise, but not so sure about usefulness if 1 of 2000 users needs that feature.
I personally would rather focus on how much effort something cost to make a program more future proof.
If it doesn't take much but you're sure that you're prepared to make bigger steps when needed in the future, it's worth the extra time in my opinion.
Plus a lot of times people suddenly would make use of things when it's easy accessible.
So the fact that not many people use it atm, doesn't mean they won't use it in the future.
We also don't ride horses anymore or use old 8086 computers.
Last edited:
Conversion to svg-xml would be quite nice exercise, but not so sure about usefulness if 1 of 2000 users needs that feature.
As I said, I am now exporting the raw data to another software package to do the plots as I like them. For me, the problem is gone

I am currently more concerned about how power response is calculated in Vituix.
Kimmo It would be useful to have an additional passive component. The complex impedance imported from file.
We had some discussion about this. Now there would be free place in component menu.
I am taking this from another thread, where things are getting off-topic -- but they are on-topic here.
My question was how power response is calculated in Vituix CAD, and I asked for the formula that is implemented in Vituix. See here and follow-up posts for more background (posts 861-868 and 870-873 in the Monkey Coffin thread).
From the response I received in the other thread it seems to me that the procedure implemented in Vituix is wrong. Kimmo, please take another look at the Tylka paper. The term in the denominator of equation (1) is the power response. This definition of the power response should be implemented in Vituix, probably in the discrete form of equation (3).
Come on, this is lame! You can do better! You seem like a guy who knows what he's doing. Don't be a douchebag and hide your knowledge from the users of your software. Provide us with the basic information needed to understand how Vituix calculates the curves we are looking at.
My question was how power response is calculated in Vituix CAD, and I asked for the formula that is implemented in Vituix. See here and follow-up posts for more background (posts 861-868 and 870-873 in the Monkey Coffin thread).
From the response I received in the other thread it seems to me that the procedure implemented in Vituix is wrong. Kimmo, please take another look at the Tylka paper. The term in the denominator of equation (1) is the power response. This definition of the power response should be implemented in Vituix, probably in the discrete form of equation (3).
Whole angle listing, weighting, directivity calculation and visualization package is too big and fragmented mess to explain anything for anybody - including myself
Some math hieroglyphs in manual cannot prove the result any better.
Come on, this is lame! You can do better! You seem like a guy who knows what he's doing. Don't be a douchebag and hide your knowledge from the users of your software. Provide us with the basic information needed to understand how Vituix calculates the curves we are looking at.
- Home
- Design & Build
- Software Tools
- VituixCAD