Please see page 2 of "Measurement preparation" : https://kimmosaunisto.net/Software/VituixCAD/VituixCAD Measurement Preparations.pdf
Gear setup for acoustical measurements. Exactly as shown. You can connect the 2i2 directly to your amp, don't need a separate DAC, it is analog-in and (volume controlled) analog-out. The only USB connection is from the 2i2 to your PC.
Gear setup for acoustical measurements. Exactly as shown. You can connect the 2i2 directly to your amp, don't need a separate DAC, it is analog-in and (volume controlled) analog-out. The only USB connection is from the 2i2 to your PC.
Few connection options added for tweeter protection to 'Gear setup for acoustical measurements': Measurement Preparations.pdf. Refresh to see the latest. Automatic compensation of HP filter works with ARTA.
^Note also that JohnPM has updated REW 5.20 to beta 7 including root filename + consecutive numbering and timing offset. Those are essential features for off-axis measurement sequences. Decent far field off-axis data should be possible to create by applying time window settings to all measurements and then exporting all measurements as text. Well done John!
^Note also that JohnPM has updated REW 5.20 to beta 7 including root filename + consecutive numbering and timing offset. Those are essential features for off-axis measurement sequences. Decent far field off-axis data should be possible to create by applying time window settings to all measurements and then exporting all measurements as text. Well done John!
Thank you John - seems a little insufficient in this instance!

I did not find anything suspicious from Time align function of Auxiliary calculator. So distance from mic to acoustic center of woofer seems to be at least 10 mm longer than from mic to tweeter's acoustic center.
There are some disagreement between REW and VituixCAD about minimum phase response:
SB woofer, gray=minimum phase response by REW, lime=MP by VituixCAD.
An externally hosted image should be here but it was not working when we last tested it.
XT25BG
An externally hosted image should be here but it was not working when we last tested it.
This causes the following:
If you trust minimum phase calculation of VituixCAD and check both MP checkboxes, the result is 29 us=10.1 mm
An externally hosted image should be here but it was not working when we last tested it.
If you trust minimum phase calculation of REW and uncheck both MP checkboxes, the result is 48 us=16.7 mm
An externally hosted image should be here but it was not working when we last tested it.
Note that frequency range should not be too wide. I have set 630...6300 Hz to reduce weighting of top octave because it's irrelevant for the task i.e. phase matching around XO frequency.
I have not tested this with PCD. Better to keep my hands off it and avoid speculation without personal experience.
Summary: This is crap method due to unknown and subjective part of minimum phase calculation, slowness and weaknesses related to off-axis measurements. Therefore using of single channel measurements, minimum phase extraction and solving of difference between acoustic centers is not recommended in VituixCAD documentation.
I am assuming that the offset calculator in VituixCAD is based on a 1 meter measurement?
And that if my measurements are at 50cm that the offset calculator will be wrong?
Is there a way/option to change the distance the measurement was taken at to calculate the offset?
Thank you,
David.
I am assuming that the offset calculator in VituixCAD is based on a 1 meter measurement?
No. It just solves a delay for LF response giving equal magnitude response to sum measurement (when both drivers were connected). Distance in millimeters is calculated with 344.0 m/s. Mic should be at middle elevation with separate (non-coaxial) drivers.
So there will be small error (e.g. 1...2 %) if measurement distance is short.
Mic should be at middle elevation with separate (non-coaxial) drivers.
Usually my two way driver measurements are centered on the tweeter.
For offset, I should be in the middle of the two drivers and further is better than closer.
Thank you,
David.
Sorry if this is a silly question but I'm wondering if there is an easier/better way to do this than I have been doing. ")
I have a passive crossover design in Vituixcad which I would like to tweak slightly, based on some minor active EQ adjustments. In other words I have tweaked the overall system response slightly (about 0.5dB or less) based on acoustic measurements and listening tests using an external line level EQ and would like to work the changes backwards into the passive crossover.
To do so first I want to measure the actual passive crossover electrical response and overlay it on the simulation, by measuring with ARTA and importing it as an overlay in the Filter response window to verify that the simulation is correct. (component tolerances etc)
Once I confirm simulation and measurement are in close agreement I would then measure the electrical output of the crossover again with the active EQ switched in which gives me a slightly different filter response curve which I can then import as an overlay and manually optimise the passive crossover component values to meet the new target, thus incorporating the changes into the passive crossover design.
I've done exactly this before earlier in the design process but it's very clunky, since there doesn't seem to be any way to scale the overlay to match the "level" of the transfer function in the filter response window.
In other words the measurement I take in ARTA might arbitrarily (depending on volume control on the AMP etc) have a peak level of "85dB" but the peak response in the filter window is around 0dB.
So I then have to scale the level in ARTA before export using scale level in the smoothed frequency response window prior to exporting the FRD - but when I am scaling I don't know exactly how much to scale it - so I scale and export, load it into Vituixcad, find it isn't correct, and repeat the process a few times trying to find the correct scale factor. Very tedious.
It would be so much easier if it were simply possible to apply a scale factor in the overlay import process or during overlay display which would allow the scale factor to be adjusted while viewing the filter response and overlay until they are brought exactly into line.
Or is there some easier way to do this when taking measurements and then bringing them back into the simulation to verify results or bring in a new target curve to optimise the crossover to ?
Visible overlays can be scaled with mouse wheel over the graph. Fine tuning by pressing Shift key while wheeling.
One possible method to clone active EQs into passive XO, but without Optimizer:
1) Measure transfer function of line level active filter and export to txt/frd.
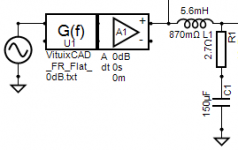
2) Insert Transfer function file and Buffer blocks between the generator and original passive crossover.

3) Load measured filter response into Transfer function file block. Adjust level with Buffer block if reference level of measurement is not 0 dB.
4) Export axial response to file with File->Export->Frequency response. Take also snapshot from SPL and Power&DI charts.
5) Short Transfer function file and Buffer blocks to disable active EQ.
6) Tweak passive filter until response is equal to snapshot. Load SPL overlay from exported file if SPL overlay (snapshot) is lost for some reason.
One possible method to clone active EQs into passive XO, but without Optimizer:
1) Measure transfer function of line level active filter and export to txt/frd.
2) Insert Transfer function file and Buffer blocks between the generator and original passive crossover.
3) Load measured filter response into Transfer function file block. Adjust level with Buffer block if reference level of measurement is not 0 dB.
4) Export axial response to file with File->Export->Frequency response. Take also snapshot from SPL and Power&DI charts.
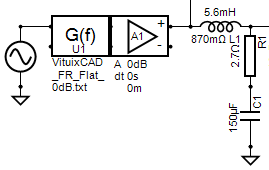
5) Short Transfer function file and Buffer blocks to disable active EQ.
6) Tweak passive filter until response is equal to snapshot. Load SPL overlay from exported file if SPL overlay (snapshot) is lost for some reason.
Attachments
Usually my two way driver measurements are centered on the tweeter.
I suppose you've already got my message in Measurement Preparations -document: all drivers should be measured at individual elevation (center of driver) in order to simulate vertical off-axis, power and DI responses properly. Exception is small tweeter + mid which can be measured at common elevation: average of tweeter and mid. This supports also time alignment with Auxiliary calculator, though that method is generally bad and dual channel measurements without minimum phase extraction should be used instead.
Thanks - that sounds like exactly what I'm looking for - except I can't get it to work.Visible overlays can be scaled with mouse wheel over the graph. Fine tuning by pressing Shift key while wheeling.
I normally use a laptop with a trackpad, so haven't tried what you suggest before, the trackpad supports two fingered scrolling but it didn't seem to work so I plugged a mouse in to check.
Same problem with the mouse - turning the mouse wheel while over the graph doesn't do anything. It doesn't seem to be possible to give focus to the graph window. If I click on the graph, hold CTRL and turn the mouse wheel while pointing at the graph it actually zooms the schematic in and out, suggesting the schematic pane is holding focus.
Likewise if I click in the schematic pane then click back on the graph then turn the scroll wheel over the graph it continues to scroll the schematic - once the schematic is clicked on focus can't be removed from it.
Any ideas ?
One possible method to clone active EQs into passive XO, but without Optimizer:
1) Measure transfer function of line level active filter and export to txt/frd.
2) Insert Transfer function file and Buffer blocks between the generator and original passive crossover.
3) Load measured filter response into Transfer function file block. Adjust level with Buffer block if reference level of measurement is not 0 dB.
4) Export axial response to file with File->Export->Frequency response. Take also snapshot from SPL and Power&DI charts.
5) Short Transfer function file and Buffer blocks to disable active EQ.
6) Tweak passive filter until response is equal to snapshot. Load SPL overlay from exported file if SPL overlay (snapshot) is lost for some reason.
Thanks for the suggestion - yes this is another way that would work if separate measurements where taken of the active part of the EQ.
However I've already taken all the measurements of the combined active EQ and passive crossover outputs, so I would prefer to simply overlay this measurement directly.
It's actually easier for me to measure this way as I can quickly take a crossover output measurement with the EQ bypassed and then again with it switched in without changing my measurement setup and be assured of high accuracy.
Last edited:
One possible method to clone active EQs into passive XO, but without Optimizer:
1) Measure transfer function of line level active filter and export to txt/frd.
2) Insert Transfer function file and Buffer blocks between the generator and original passive crossover.
3) Load measured filter response into Transfer function file block. Adjust level with Buffer block if reference level of measurement is not 0 dB.
4) Export axial response to file with File->Export->Frequency response. Take also snapshot from SPL and Power&DI charts.
5) Short Transfer function file and Buffer blocks to disable active EQ.
6) Tweak passive filter until response is equal to snapshot. Load SPL overlay from exported file if SPL overlay (snapshot) is lost for some reason.
Looking into this approach a bit further - the active EQ that I'm trying to apply is actually quite simple - a +0.5dB, 12dB/oct high pass shelf centred at 2Khz.
So I thought I'd have a look at the built in active shelf feature instead of the external function import feature.
The first problem I ran into - only 1st order 6dB/oct shelves are supported, not 2nd order 12dB/oct. I tried cascading two 1st order high shelves but the result was not what I expected, cascading two still seems to give a 1st order slope but just with the rollover frequency offset somewhat, however my filter maths is not good enough for me to know whether this should actually work or not.... ? Normally cascading buffered filters should add their slopes.
The second problem I ran into - if as a test I drop in a 1st order shelf with a centre frequency of 1000Hz and a maximum gain of 12dB then I would expect the centre or "rollover" frequency of 1Khz to be +6dB, right ?
In actual fact what I see is that the gain is +6dB at 500Hz not 1Khz, and that 1Khz is +9dB. Is this a bug in the equation for the shelf filter ? Doesn't seem right to me.
Do you have a suggestion on how I could implement an active 12dB/oct 0.5dB 2Khz high shelf ? I would use the function import block to import by frd, but after a quick look I haven't found any other programs that are able to generate a 2nd order shelf and output as an frd.
Last edited:
The first problem I ran into - only 1st order 6dB/oct shelves are supported, not 2nd order 12dB/oct.
Order of shelf is selected with Shape combo box below schematic. 2nd order with adjustable Q is supported.
The second problem I ran into - if as a test I drop in a 1st order shelf with a centre frequency of 1000Hz and a maximum gain of 12dB then I would expect the centre or "rollover" frequency of 1Khz to be +6dB, right ?
In actual fact what I see is that the gain is +6dB at 500Hz not 1Khz, and that 1Khz is +9dB. Is this a bug in the equation for the shelf filter ? Doesn't seem right to me.
There are at least two different standards for nominal frequency of shelving filters. This is controlled with DSP system selection in Options window. Nominal frequency is at the middle gain with Hypex, miniDSP and Xilica. Other choices have "-3dB" definition which is emulation of common analog circuits.
Well now I feel stupid. I didn't even notice the shape drop down box, somehow. Thanks!Order of shelf is selected with Shape combo box below schematic. 2nd order with adjustable Q is supported.
That's interesting. I've only ever dealt with shelving filters in the Analogue domain before and have never come across any definition other than the centre rollover frequency being half the final gain/cut.There are at least two different standards for nominal frequency of shelving filters. This is controlled with DSP system selection in Options window. Nominal frequency is at the middle gain with Hypex, miniDSP and Xilica. Other choices have "-3dB" definition which is emulation of common analog circuits.
The asymmetry of a -3dB definition doesn't make any sense to me - especially in the case where the total gain/cut off the shelf is less than 3dB...
But at least I now know what setting to use to give the behaviour I'm expecting. Thanks.
The asymmetry of a -3dB definition doesn't make any sense to me - especially in the case where the total gain/cut off the shelf is less than 3dB...
It's not very rare definition though it looks a bit "German" via VituixCAD because Behringer DCX and FourAudio PPA uses it. Middle gain definition is usually easier to handle (imo) and probably more common in modern dsp systems.
I suppose almost everyone is familiar with this image:
Mr. Linkwitz did not specify either that nominal frequency should be f0=sqrt(f1*f2). Dimensioning is easier than with average gain definition if we specify that nominal/corner frequency is f2 because frequency and gain stay independent.
Last edited:
Strange. It's actually a Behringer DEQ2496 that I'm using for the digital EQ to create the shelf I want to include in the crossover in the first place.It's not very rare definition though it looks a bit "German" via VituixCAD because Behringer DCX and FourAudio PPA uses it. Middle gain definition is usually easier to handle (imo) and probably more common in modern dsp systems.
As far as I know the PEQ shelf in the DEQ2496 specifies the half gain frequency but now you have me wondering!
I'm going to measure it to find out for sure...If you think about most of the applications of a shelf such as baffle step compensation, it's the halfway point that is the most meaningful, as the baffle step frequency is considered to be the halfway point in the transition.
-3dB only makes sense for a filter response that trends towards infinite attenuation which is not the case for a shelf.
Two different shelf definitions is still easier to implement into simulator application than three or more different PEQ definitions (which is very unfortunate reality imo). VituixCAD supports two of those: analog version with Q specifying "-3dB" points for BW, and digital version with Q specifying half gain points for BW. Behringer, FourAudio, Hypex and Xilica options use the first one, and miniDSP the last one. Some devices such as Xilica use BW instead of Q, but typically calculated Q is visible for user. But these two options do not cover all devices in the market
Also Bessel HP/LP filter has two different standards for corner frequency: -3dB point and phase normalized by filter order. FourAudio option uses the first one. Behringer, Hypex, miniDSP and Xilica the last one.
And finally, calculated frequency response is not entirely correct with Hypex option because they don't have public documentation how biquad coefficients are calculated. Didn't get private info either. Hypex is not using basic calculation represented e.g. in Cookbook formulae for audio equalizer biquad filter coefficients by RBJ.
So this dsp scene is more or less device dependend pain in the a.. Manufacturers think their configurator applications are adequate.
Also Bessel HP/LP filter has two different standards for corner frequency: -3dB point and phase normalized by filter order. FourAudio option uses the first one. Behringer, Hypex, miniDSP and Xilica the last one.
And finally, calculated frequency response is not entirely correct with Hypex option because they don't have public documentation how biquad coefficients are calculated. Didn't get private info either. Hypex is not using basic calculation represented e.g. in Cookbook formulae for audio equalizer biquad filter coefficients by RBJ.
So this dsp scene is more or less device dependend pain in the a..
Manufacturers think their configurator applications are adequate.Rev 2.0.13.6 (2019-04-08)
One more German dsp added to DSP system list in Options window: Nova 96k which is at least Nova DC 8000 in practice. That is also using analog equivalent PEQ and Shelf parameters and -3dB point for Bessel HP/LP. Just like FourAudio PPA, but with 96k sample rate which produces less smearing close to Nyquist frequency.
One more German dsp added to DSP system list in Options window: Nova 96k which is at least Nova DC 8000 in practice. That is also using analog equivalent PEQ and Shelf parameters and -3dB point for Bessel HP/LP. Just like FourAudio PPA, but with 96k sample rate which produces less smearing close to Nyquist frequency.
- Home
- Design & Build
- Software Tools
- VituixCAD