Hello kimmosto.
Thank you for developing this fantastic software!
I have some problems with vertical directivity plot.
I entered 0, 10, 20, 30 horizontal responses.
And added 10, 20, 30 responses for vertical.
Names seem to be identified OK, they show up correct
angles in Hor and Ver fields of frequency response
table for each driver in Drivers tab.
Horizontal Directivity picture shows plots for all 4 angles (0, 10, 20, 30).
However, Vertical Directivity picture shows plots for 3 angles only(0, 10, 20)
30 degree plot is missing.
I tried to load only horizontal plots. Same problem, 4 plots for horizontal and
30 degree plot is missing for vertical.
I should be doing something wrong, but could not figure out what.
All plots are enabled in chart traces
Another strange (but not critical) thing is when I change trace colors for directivity plots, new colors are "applied" when corresponding button is pressed.
But it forgets color change if I switch to different diagram and then switch back to the one where colors were changed.
Last edited:
^This is standard problem with measurement set which does not cover whole 0-90 deg for half space design or 0-180 deg for full space design. The last one is recommended enabling all features including power&DI to full space, rotation of drivers (side woofers) etc.
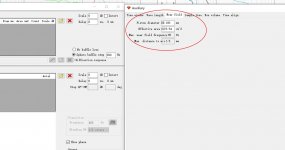
Problem is that 30 deg off-axis measurement of driver is not adequate for 30 deg off-axis simulation of speaker if driver is not located at the origin of speaker (X,Y=0,0). For example if you move driver down i.e. Y mm is negative, exit angle from the driver towards virtual microphone is greater than 30 deg while simulating positive vertical angles. So vertical 30 deg response will not be visible if Interpolate is checked in Options window. Response interpolation requires that simulated off-axis angle must be within measured sector in both planes (=inside measured space on spherical surface).
You can ignore missing measurements with combination of two settings in Options window:
- uncheck Interpolate (selects response to nearest measured angle)
- select Angle step 0 deg (simulates to measured off-axis directions only)
Member
Joined 2003
I've noticed that when using the IR to FR tool, the output directory will automatically change to the same directory of the last loaded IR file.
I was wondering if you could provide this same behaviour to the merger tool. I keep saving files to the wrong directory, forgetting to change in the directory selection below the save button. Same for the Calculator tool, auto destination to the same directory as the source files would be great.
An alternative option would be to remove the "destination directory" field, and provide an output directory prompt on file save, that defaults to the directory of the last loaded file.
Thanks!
^I suppose most of the users (including me) have the same problems with destination directories.
I think this is good option at least for the Calculator: "provide an output directory prompt on file save, that defaults to the directory of the last loaded file".
Merger is not so simple because destination directory is good to save to merger project (vxm) file for the next merging of the same project+driver, and directory of the last loaded (far field) measurement is not the best place for merged responses imo. So default directory in browse folder dialog could be:
a) Directory of the last loaded (far field) response if merger project (vxm) is not loaded.
b) Directory specified in merger project (vxm) if merger project is loaded.
Destination text box is not needed if program asks directory in both cases.
P.S. In the beginning I wasn't happy with Convert IR to FR tool's automation because I wanted txt/frd files to different directory than measurement pir/mls/crp files. Then I just decided to use the same directory for both, and mental problems were gone")
I think this is good option at least for the Calculator: "provide an output directory prompt on file save, that defaults to the directory of the last loaded file".
Merger is not so simple because destination directory is good to save to merger project (vxm) file for the next merging of the same project+driver, and directory of the last loaded (far field) measurement is not the best place for merged responses imo. So default directory in browse folder dialog could be:
a) Directory of the last loaded (far field) response if merger project (vxm) is not loaded.
b) Directory specified in merger project (vxm) if merger project is loaded.
Destination text box is not needed if program asks directory in both cases.
P.S. In the beginning I wasn't happy with Convert IR to FR tool's automation because I wanted txt/frd files to different directory than measurement pir/mls/crp files. Then I just decided to use the same directory for both, and mental problems were gone
Member
Joined 2003
My problem is that the files are ending up in a completely different project directory, and I have to open up the tool again to see where they went so I can move the files over. In this instance, a file location prompt every save, even if I have to change the destination directory on every save appears more convenient to me.
Anyway, these are not major issues, only convenience features, so you can decide to leave as-is if you like, it is only a suggestion.
To be honest, I've never saved a merger project file, usually I complete the merge as I need and then move on, there's not much need to revisit the merge after it's complete, and if I do, it's not much work to load near and far response and set offset, etc. again.
2.0.63.3 (2021-03-23)
Calculator, Merger
* Destination directory text box and browse folder button removed. Folder is selected when Save button is clicked.
Options
* Klippel NFS checkbox enabled with VACS balloon only.
Enclosure
* Project file reading order changed to prevent possible problems with isobaric and/or multiple drivers in special connection.
Member
Joined 2003
2.0.64.0 (2021-03-24)
* Shelving LP/HP filter of 'Generic' DSP option changed to f=dBgain/2 to be compatible with cookbook by RBJ.
* Other than miniDSP use biquad coefficients with unnormalized a0, and sign of a1 and a2 is positive to be compatible with cookbook by RBJ.
* Coefficient format visualized inside Digital Biquad block.
Thanks again for all the work Kimmo!!
I have maybe a bit of an odd request.
I really like the SPL tracer a lot and I use it sometimes for also non-speaker related acoustics.
Unfortunately it sometimes happens that either the frequency or the SPL/amplitude are on linear scales (in volts for example)
(don't ask why, it's what people sometimes do )
Would it be possible to make an option to makes these axis linear as well (like the impedance atm) ?
I have maybe a bit of an odd request.
I really like the SPL tracer a lot and I use it sometimes for also non-speaker related acoustics.
Unfortunately it sometimes happens that either the frequency or the SPL/amplitude are on linear scales (in volts for example)
(don't ask why, it's what people sometimes do
)Would it be possible to make an option to makes these axis linear as well (like the impedance atm) ?
^Impedance export supports minimum phase extraction with linear magnitude so it should be valid also for pressure, Volts etc. with generated phase. So trace and export those with right scale. One possible limit is related to axis minimum which should be >= 0.
Left (dB) axis supports also negative Y values, but assumes that values are dB so minimum phase extraction won't work. Exporting of plain f,Y points (without generated phase) is possible with Edit->Copy raw SPL.
For tracing of linear frequency axis:
2.0.64.1 (2021-03-27)
SPL Trace
* Added 'Log f axis' checkbox to support linear frequency scale.
Note! Exports have standard 1/48 oct frequency step.
* Axis type radio buttons replaced with 'Log Z axis' checkbox.
^Impedance export supports minimum phase extraction with linear magnitude so it should be valid also for pressure, Volts etc. with generated phase. So trace and export those with right scale. One possible limit is related to axis minimum which should be >= 0.
Left (dB) axis supports also negative Y values, but assumes that values are dB so minimum phase extraction won't work. Exporting of plain f,Y points (without generated phase) is possible with Edit->Copy raw SPL.
For tracing of linear frequency axis:
2.0.64.1 (2021-03-27)
SPL Trace
* Added 'Log f axis' checkbox to support linear frequency scale.
Note! Exports have standard 1/48 oct frequency step.
* Axis type radio buttons replaced with 'Log Z axis' checkbox.
You deserve a medal!

Yes, I could actually just choose impedance for it.
I guess one of these cases that the solution is a little TOO obvious
Would it maybe be possible to just also change the units?
I do realize it's something extremely silly, but it just makes the exporting and importing process a little easier
Would it maybe be possible to just also change the units?
For example FRD and ZMA files do not contain header row with units so changing units in UI is kinda user writing yellow stickers for him/herself. Purpose of dBSPL on the left and Z Ohms on the right is to inform user about nature of the traces and exports with the most common case.
Someone probably likes more anonymous X, Y, Y2 axles and group of check boxes and text boxes controlling behavior of the application though it would not change the result.
Member
Joined 2003
For example FRD and ZMA files do not contain header row with units so changing units in UI is kinda user writing yellow stickers for him/herself. Purpose of dBSPL on the left and Z Ohms on the right is to inform user about nature of the traces and exports with the most common case.
Someone probably likes more anonymous X, Y, Y2 axles and group of check boxes and text boxes controlling behavior of the application though it would not change the result.
That's true, it just maybe a little confusing from user experience.
But yes, I agree, you can just import the frd or zma files.
Yes, I am familiar with that one, but it doesn't seem to auto trace.For "unconventional" graph tracing it might be better to look WebPlotDigitizer which is a generic tracer for all sorts of plots, not specific to audio graphs. A bit more fiddly to figure out but it works well.
One of the main reasons I use VituixCAD for tracing.
Member
Joined 2003
It will auto trace just fine (that's kind of the whole point), just mask out the area to trace and tell it what colour the line is. Use the "automatic extraction" features on the right side once you load an image. If you have black and white plot, you may have to do a little manual deletion of points if it grabbed the grid lines.
Last edited:
It will auto trace just fine (that's kind of the whole point), just mask out the area to trace and tell it what colour the line is. Use the "automatic extraction" features on the right side once you load an image. If you have black and white plot, you may have to do a little manual deletion of points if it grabbed the grid lines.
Mmmm, ok thanks for the tip
I will have a look at it again then.
It has been a while since I mostly use VituixCAD for these kind of things.
kimmosto
sometimes is needed to take a closer look at the graphs in the SPL window. Wouldn't it be useful to make scaling possible? Just like it is done in REW. Now I can change the display not of the entire frequency range, but of the part I need in Options. The offer only applies to the SPL window.
sometimes is needed to take a closer look at the graphs in the SPL window. Wouldn't it be useful to make scaling possible? Just like it is done in REW. Now I can change the display not of the entire frequency range, but of the part I need in Options. The offer only applies to the SPL window.
^If you mean zoom in with mouse just like in REW that will never happen.
Frequency limits is changed via Options window but span and maximum are adjustable also with mouse wheel. Max with mouse wheel, and span with Ctrl + mouse wheel when mouse cursor is closer to Y-axis to be scaled. Exception: Directivity chart follows max and span settings of SPL chart.
In addition, changelog says: 2.0.63.0 (2021-03-12) Click chart to enable scaling features with mouse wheel on Windows XP, 7 and 8.
I suspect that many...most of the users having obsolete Windows are not aware how scaling should work.
- Home
- Design & Build
- Software Tools
- VituixCAD