Hi.
I'm new to using semi inductance (Extended Z Model) and have a question.
Other software like Hornresp uses 5 parameters, including Re', which does not seem to be present in VituixCAD.
As I don't have a version of excel capable of running the spreadsheet to calculate these parameters, I was hoping VituixCAD could do it instead.
Will that be possible, and if so, how do I find/calculate Re' please?
Thanks,
David.
^I've tried to keep driver database simple and static without adding kinda duplicate fields. If you extract T/S-parameters from impedance measurements with 'Calculate T/S parameters' function and extended parameters are solved, Re will include eddy current losses i.e. equals to Re' in Hornresp. Also datasheet of Scan-Speak has both Re for traditional T/S and Re' for extended parameters. If you decide to enter extended parameters instead of traditional T/S, you should enter Re' on Adv.datasheet to Re field in Enclosure tool. But if you are happy with traditional T/S, you should enter Re on standard datasheet to Re field, and leave extended parameters blank.
P.S. At the moment Scan-Speak drivers have traditional T/S parameters in online database, though extended fields are not blank.
Enclosure tool is not very academic so simplifications exist also in LOG model. If Creep beta > 0, Cms field is C0, Rms is R0 and fs is f0. Possibly confusing, but I don't see much value to separate parameters as long as radiator simulation is done with the same program. Switching of models is not necessary and extended model is not needed for driver selection and box dimensioning (which is the purpose of Enclosure tool).
kimmosto,
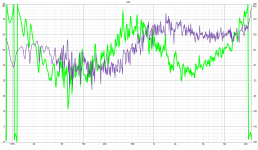
Thank you, everything became clear in the picture. There is a question about exporting data from REW. I am exporting the tweeter frequency response graph from a REW. No smoothing. I get a .txt file. Uploading to VituixCad2. Source, wire and speaker only. Nothing more. Why are the minimum phase graphs so different in REW and VituixCad2?
Thank you, everything became clear in the picture. There is a question about exporting data from REW. I am exporting the tweeter frequency response graph from a REW. No smoothing. I get a .txt file. Uploading to VituixCad2. Source, wire and speaker only. Nothing more. Why are the minimum phase graphs so different in REW and VituixCad2?
Attachments
Last edited:
They are not the same, but as already mentioned probably close to hundred times on diyaudio, minimum phase calculation is just subjective or lottery. Error could be anything depending on assumptions (by user or automatic slope detection) about magnitude response outside measured or imported frequency range.
In this case:
REW is somehow aware or just assumes that magnitude response does not really jump at HF so it keeps MP response close to 0 deg up to 24k.
VituixCAD detects obvious jump in magnitude response at HF so it calculates that MP response rises towards 24k.
Subjective judgement could be that VituixCAD is correct and REW is not, but probably both are wrong because MP response calculated from limited acoustical data is wrong by default.
We should just forget whole minimum phase if it's not mandatory and built in to function.
If there is data up to 24 kHz, and we need to plot up to 48 kHz, then the work will be done on assumptions. But REW received data up to 24 kHz and plotted up to 24 kHz. No unknown data. Then the data is transferred as a text file to VituixCad2. VituixCad2 should plot up to 24 kHz with data up to 24 kHz. There are no unknowns. Maybe there are different libraries, old and newer, or just different, which are used for the calculation.about magnitude response outside measured or imported frequency range.
^Minimum phase response is useless and extraction is not recommended when importing responses from measurement program to simulation so what's the problem if REW shows more wrong than VituixCAD though REW is source and VCAD is client? Nothing. Just forget all that and focus to process measurements so that data is at least useful. That zigzad includes reflections or other noise so it's worthless anyway.
"Minimum phase response is useless and extraction is not recommended when importing responses from measurement program to simulation"
All is that. There is no need to import a response with a minimum phase. But this is not done. The import is done with the measured phase. And only then this or that program can generate the minimum phase based on the measured phase. The minimum phase is easy to understand. Therefore, many take advantage of this. It's like a smoothed graph and an unsmoothed graph. Smoothed graph is easy to read.
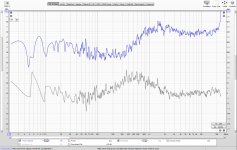
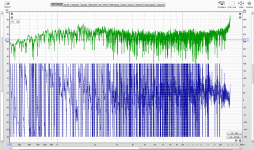
The question is different. There is a text file containing three columns of data. Freq (Hz), SPL (dB), Phase (degrees). The third column is the measured phase. I looked at this data. Made the import of this data into REW. There are no jumps in the measured phase above 20 kHz. How do they arise in the minimal phase?
All is that. There is no need to import a response with a minimum phase. But this is not done. The import is done with the measured phase. And only then this or that program can generate the minimum phase based on the measured phase. The minimum phase is easy to understand. Therefore, many take advantage of this. It's like a smoothed graph and an unsmoothed graph. Smoothed graph is easy to read.
The question is different. There is a text file containing three columns of data. Freq (Hz), SPL (dB), Phase (degrees). The third column is the measured phase. I looked at this data. Made the import of this data into REW. There are no jumps in the measured phase above 20 kHz. How do they arise in the minimal phase?
Attachments
Last edited:
And only then this or that program can generate the minimum phase based on the measured phase. The minimum phase is easy to understand. Therefore, many take advantage of this.
It does not look easy to understand imo.
Minimum phase response is calculated from magnitude response. Calculation does not use measured or any other phase. Whole idea of MP extraction is that phase response does not exist or is damaged, and application tries to calculate phase response assuming that system is minimum-phase. Also that is just an assumption - not necessarily fact. For example excess delay compared to on-axis exists to rear sector with common speaker concepts, and dipole and leaking radiators have predictable and unpredictable frequency-dependent polarity inversions so whole minimum phase concept is quite worthless P.O.S.
Member
Joined 2003
I don't think it's a case of "many take advantage of minimum phase" because it's easy to understand, but rather that many start into speaker design with single channel USB mic solution, so minimum phase response becomes a necessity. It's unfortunate as it often leads to a lack of understanding of phase overall, and requires extra measurement steps just to determine relative acoustic offsets between drivers. It's a Band-Aid solution for the simple fact that the single channel measurement is unable to record time of flight for an accurately locked FFT timing reference.
FFT calculates phase response also from impulse response measured with USB mics. Timing of measurement signal is not locked to electrical output signal due to asynchronous I/O so different measurements don't have common physical or electrical reference point -> phase of different measurements drifts back and forth or is normalized by IR peak.
Actually missing thing is just timing offset which locks timing of individual measurements to known physical point (or electrical trigger) that application could calculate correct sum of multiple signals from individual drivers to selected directions.
Few years B.C. someone got an idea that minimum phase response would help in this. That's not entirely wrong though response without excess phase is still floating/abstract compared to fixed physical reference point (or electrical trigger). Final mistake happened when some anti-Nobelist got an idea that measured phase is "bad" and should be replaced with calculated phase no matter is it really damaged or perfectly healthy.
Sometimes phase response is missing which makes calculated phase handy. Some mathematical analyzes/simulations produce magnitude only so phase calculation helps to construct full data with some assumptions about minimum-phase.
However, to find out the latency of one speaker relative to another, just look at the excess group delay graph. To get it, it's needed to generate a graph of the minimum phase.
Minimum phase calculation for whole construction is internal/hidden from user by default, but the result is possible to show in SPL chart. Result is used for excess phase, and that is used for excess group delay (of whole construction).
Measurement and data processing instruction doesn't contain anything for minimum phase extraction so it should be obvious that MP is probably inaccurate side product, intermediate result or target.
The problem with the different display of the minimum phase in REW and VituixCad2, it seems to me, that in REW the minimum phase is calculated from unsmoothed magnitude data - smoothing none, and in VituixCad2 the minimum phase is calculated from smoothed data - smoothing 1/48. Although the driver page says smoothing none, the graph is smoothed to 1/48. The screenshots show unsmoothed magnitude and measured phase in REW and VituixCad2. They should be the same, because export from REW is done without smoothing.
Attachments
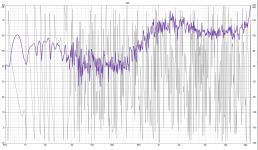
^No, no and once again no. Already explained that different policy in slope estimation is the most probable reason, but perhaps google translator fails to deliver my message. I just tested that REW seems to assume that magnitude response extends 0 dB/oct. up to infinity above maximum available frequency. VituixCAD forecasts both HP and LF slopes. Result in usually much better, but not necessarily always because life outside measured range is really unknown.
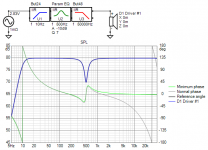
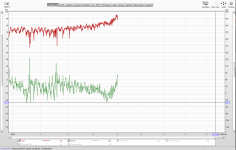
A bit unfair comparison because frequency response is created with VCAD (rev 2.0.61.1 build 2021-02-03) and imported to ARTA and REW as IR. Differences are clearly visible at HF.
VCAD detects slopes and makes perfect job with this particular test material. Some other frequency response shape could give much less accurate result, but the point is that MP is not constant fact. It's partly result of calculation principle/policy, user's decisions and luck.
VCAD detects slopes and makes perfect job with this particular test material. Some other frequency response shape could give much less accurate result, but the point is that MP is not constant fact. It's partly result of calculation principle/policy, user's decisions and luck.
Attachments
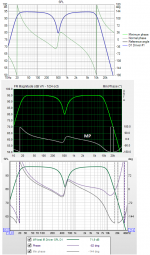
^Mistake is a bit strong word but it's illogical and causes mirroring from horizontal +100...+170 deg to vertical +/-100...+/-170 deg. I'm confident that result is still okay if Interpolation and Mirror missing are checked in Options. Angle step could be 5 deg in Options, though 10 deg is faster and adequate for CTA-2034-A spinorama and does not cause so much response interpolations.
Measurement instructions try to be simple. Short version:
1) Measure 0...+180 deg step 10 deg in horizontal plane. No need to measure negative angles if baffle is horizontally symmetrical.
2) Measure +10...+170 deg step 10 deg in vertical plane always if drivers are not circular or squared (W=H) e.g. elliptical horns and rectangular AMTs or ribbons. Skipping of whole vertical plane (hor mirrored to ver) does not cause more than 0.5 dB error to power response with circular drivers. Error due to skipping of negative angles could be less than 0.3 dB.
Automatic turntable helps a bit so it's easy to verify how much ignoring whole ver plane or negative angles cause error.
- Home
- Design & Build
- Software Tools
- VituixCAD