Since the 1930's, measurement of Total Harmonic Distortion (THD) has been recognised as a poor arbiter of sound quality. The Gedlee Metric, Gm, attempts to overcome the shortcomings of traditional THD measurements, and to quantify non-linearity in a way that corresponds much more closely to the psycho-acoustical perception of distortion. It is derived from the Transfer Function T(x) of the DUT. Since, in principal, any signal can be used as an input to determine the Transfer Function, Gm can be said to be a characteristic of the DUT rather than a characteristic of the output signal. Characteristics of the human hearing system such as masking have also been allowed for in the formula for Gm. Experimental results indicate that for low to intermediate levels of non-linear distortion, the Gedlee Metric has a much improved correlation to the subjective perception of distortion, and is a significant predictor of subjective sound quality, when compared to traditional metrics such as THD and IMD.
The original AES papers describing the Gedlee Metric are available on Earl Geddes's website:
Lee and Geddes: Auditory Perception of Nonlinear Distortion, AES October 2003. Part I: http://www.gedlee.com/Papers/Distortion_AES_I.pdf
Part II: http://www.gedlee.com/Papers/Distortion_AES_II.pdf
An undoubted obstacle to the adoption of Gm is that the mathematics involved in calculating Gm are complicated compared to the simplicity of THD calculations. It is also likely that many manufacturers are comfortable with consumers' misguided belief that low THD is a meaningful predictor of sound quality, and design and market their products accordingly.
The calculation of Gm involves two steps: 1) the derivation of a function T(x) which represents the normalised transfer function of an audio black box and which is amenable to differentiation; b) plugging T(x) into the equation for the Gedlee Metric Gm proposed by Geddes and Lee in their AES papers.
Published suggested methods for deriving T(x) have to date utilised either the theory of non-linear systems or trigonometric identities to derive a polynomial expression of T(x). I found both approaches very complicated, so I developed a hassle-free method of calculating Gm, and have created a spreadsheet to facilitate this. The spreadsheet derives the coefficients of a trigonometric expression of T(x). This set of coefficients can then be plugged into a short worksheet for Sage Math Online which then calculates Gm virtually instantly. The spreadsheet contains directions on how to use it, together with a breakdown of the mathematics I have used.
The rapid calculation of Gm is therefore possible, given a sinewave input to the DUT and the amplitude and phase information of the harmonics present in the output.
The spreadsheet file can be downloaded from Google Drive using the link below (the file is too large to post directly on diyaudio).
********************
Gm_Sine_Mixer_and_Coefficient_Calculator_Shared.xslx
Download from: Gm_Sine_Mixer_and_Coefficient_Calculator_Shared.xlsx - Google Drive
This version has been developed in Excel 2016, and is best viewed with Auto-hide Ribbon selected. It should also work without problems in Excel 2010 and Excel 2013. It does not load correctly into LibreOffice Calc, but a version for Calc also exists which I may post in due course if there is any demand for it.
********************
Questions/comments on the use of this solution are invited, though I am reluctant to get embroiled in discussions such as subjective/objective assessments of audio gear, the "best" objective assessments, etc. I am simply posting here a tool that simplifies a particular calculation. The Gedlee Metric does, however, have the potential to explain and quantify, for example, the difference between alternative circuit architectures, even when THD measurements are the same (see first two examples in the spreadsheet).
Forum contributors who quote THD and other distortions in their postings of their designs are, however, encouraged to use this tool to quote Gm too.
Thanks go to Earl Geddes for his support in this study.
Stephen
Last edited:
Fail! Can't download it with Chrome, even after connecting a bunch of seemingly related google apps.
I definitely would be interested in a Calc version!
You should be able to download the .ods version for Calc here:
https://drive.google.com/file/d/0B8AECD_JO_JMLUI2Rk9ieHpSYnM/view?usp=sharing
This version, which does not work properly in Excel, is a bit different from the Excel version. It incorporates two different solutions: Method A is the same as the Excel version; Method B uses line statistics to derive the coefficients for a polynomial expression of the transfer function T(x).
Method B was actually my original idea and predates Method A. It is not as precise as Method A, but in practice the two methods produce the same result for Gm to around 5 or 6 s.f. Method B is, however, more forgiving if the harmonics entered are not in exact quadrature.
The line statistics in Excel are nothing like as accurate as they are in Calc, which is why I removed Method B from the Excel version. But as Method A is an exact solution, this is not a great loss. I've left B in the Calc version principally because my Linux box died in December.
Fail! Can't download it with Chrome, even after connecting a bunch of seemingly related google apps.
Have you managed to download it? I have no issues in Edge. If you PM me with your email address I will email it to you if necessary.
All.
In previous discussions, I cannot tell you how many times I have found that people misunderstood what I/we have done. Even so-called "experts" get it wrong. If the metric is useful, then fine, if it is pointless then that's fine too (personally, I don't do much "distortion" testing as it is not highly correlated with perception), but let's at least make sure that we all understand the principles and not continue to propagate the erroneous ideals that have abounded.
Ludus - thanks for your work. I applaud the effort.
Fail! Can't download it with Chrome, even after connecting a bunch of seemingly related google apps.
Redid the downloads over 12 hours later, and this time I obtained good results.
Thanks!
All.
In previous discussions, I cannot tell you how many times I have found that people misunderstood what I/we have done. Even so-called "experts" get it wrong.
IME, the same thing applies to many situations where people who happen to advocate the importance of perceptually vanishing amounts of common artifacts and spurious responses make big errors trying to apply the effects of perceptual masking to distortion and noise measurements, if they try it at all.
Figures 3 and 4 in your first of the two papers seem to lay out the basics of this situation quite simply and clearly.
It may be a case of perceptual inability to correctly perceive reliable evidence that does not agree with their prejudices and long-held positions.
Upon a closer reading of the second paper I find two things I'd correct:
#1. Looking at Table 1 and Figures 2 and 3, I see THD and IMD expressed in values that look like decibels, not percentages, but for some reason they're all positive values. So of course you're going to get "negative" correlations for both if you reverse their signs yet keep the reference metric - the subjective score given by the participants - un-reversed.")
So a correct Table 5 should've presented the correlation coefficients as:
+0.423 for THD
+0.345 for IMD
+0.68 for G_m
(I remain suspicious of the use of very different p-values for each, but unfortunately I don't have the expertise in statistics to comment on that.)
#2. In elaborating Figure 5 the authors drop some of the values that were included in Figure 4, based on the contention that G_m is looking like a poor predictor of "extreme" levels of distortion, and they now get a very much improved correlation for G_m that reaches r=0.95.
But if G_m is the metric under analysis, yet to be proven to be a good predictor of distortion, you can't use G_m itself to decide which values represent "extreme distortion" so you can then drop them from the analysis. You have to use the same metric that was chosen as a reference from the beginning of the study: the subjective scores from the human listeners. So rather than dropping the data points associated with stimuli 5, 7 and 10 in Table 6 and corresponding simply to the highest values of G_m, the authors should've dropped the data points with the subjective scores indicating the worst distortion, i.e. those corresponding with stimuli 3, 9 and 17 (with mean subjective scores all above 2.5).
We do that, we get something that looks more or less like this: Wolfram|Alpha: Computational Knowledge Engine
(Since the free version of WolframAlpha doesn't allow me to include as many points as I want I had to drop some, and I tried to pick from the smaller values most tightly clustered toward the center so as not to influence the resulting slope by too much, namely stimuli 8, 11, 15 and 20.)
Now we get an r^2 of about 0.67. Let's call it 0.7 in case my newly eliminated data points degraded it too much. From that we now get an r=0.84, which is still clearly favorable compared to the THD and IMD coefficients, but not quite as astoundingly favorable as the one derived in the original text.
#1. Looking at Table 1 and Figures 2 and 3, I see THD and IMD expressed in values that look like decibels, not percentages, but for some reason they're all positive values. So of course you're going to get "negative" correlations for both if you reverse their signs yet keep the reference metric - the subjective score given by the participants - un-reversed.
So a correct Table 5 should've presented the correlation coefficients as:
+0.423 for THD
+0.345 for IMD
+0.68 for G_m
(I remain suspicious of the use of very different p-values for each, but unfortunately I don't have the expertise in statistics to comment on that.)
#2. In elaborating Figure 5 the authors drop some of the values that were included in Figure 4, based on the contention that G_m is looking like a poor predictor of "extreme" levels of distortion, and they now get a very much improved correlation for G_m that reaches r=0.95.
But if G_m is the metric under analysis, yet to be proven to be a good predictor of distortion, you can't use G_m itself to decide which values represent "extreme distortion" so you can then drop them from the analysis. You have to use the same metric that was chosen as a reference from the beginning of the study: the subjective scores from the human listeners. So rather than dropping the data points associated with stimuli 5, 7 and 10 in Table 6 and corresponding simply to the highest values of G_m, the authors should've dropped the data points with the subjective scores indicating the worst distortion, i.e. those corresponding with stimuli 3, 9 and 17 (with mean subjective scores all above 2.5).
We do that, we get something that looks more or less like this: Wolfram|Alpha: Computational Knowledge Engine
(Since the free version of WolframAlpha doesn't allow me to include as many points as I want I had to drop some, and I tried to pick from the smaller values most tightly clustered toward the center so as not to influence the resulting slope by too much, namely stimuli 8, 11, 15 and 20.)
Now we get an r^2 of about 0.67. Let's call it 0.7 in case my newly eliminated data points degraded it too much. From that we now get an r=0.84, which is still clearly favorable compared to the THD and IMD coefficients, but not quite as astoundingly favorable as the one derived in the original text.
OK, I've read up a bit on p-values and right now the p-values seem to me by far the most problematic part of the study: at p=0.06 and p=0.13 neither correlation coefficient estimations for THD or IMD reach "statistical significance" as traditionally defined in science (and the traditional p=0.05 was quite a generous margin already). So really neither THD nor IMD can be said to be weak correlates of perceived distortion on the basis of this study alone.(I remain suspicious of the use of very different p-values for each, but unfortunately I don't have the expertise in statistics to comment on that.)
Now the correlation coefficient for Gm, at p=0.001, is indeed a probably correct/real value and it seems to prove that Gm really is a good predictor of perceived distortion, but it can't be compared to THD and IMD when their own correlation values are so unreliable. So that would mean this study does not properly support the claim that THD and IMD are inferior and should be replaced with Gm.
Inexpensive audio analyzer now with GedLee Metric built in
Hello Everyone,
I've posted a Group Buy (GB) announcement here: GB for Virtins MI Pro for RTX6001 autoranging/autoscaling & for soundcard end users - diyAudio
If you've always wanted the ability to measure audio distortion not only with the old fashioned THD and IMD but with non-coherent distortion (NCD) and with the GedLee Metric, please go to the above URL GB announcement and check it out.
The Gedlee Metric, Gm, attempts to overcome the shortcomings of traditional THD measurements, and to quantify non-linearity in a way that corresponds much more closely to the psycho-acoustical perception of distortion.
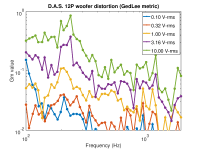
I have measured the GedLee distortion of a some woofer I am evaluating, see attached plot. What does that tell me? Is a GedLee gm value of 0.1 "good" or "bad"? What about gm = 1 or gm = 0.01?
In other words: are there any hints on the correlation of the GedLee gm value with the audibility of distortion?
Attachments
but not quite as astoundingly favorable as the one derived in the original text.
OK, I've read up a bit on p-values and right now the p-values seem to me by far the most problematic part of the study: at p=0.06 and p=0.13 neither correlation coefficient estimations for THD or IMD reach "statistical significance" as traditionally defined in science (and the traditional p=0.05 was quite a generous margin already). So really neither THD nor IMD can be said to be weak correlates of perceived distortion on the basis of this study alone.
Now the correlation coefficient for Gm, at p=0.001, is indeed a probably correct/real value and it seems to prove that Gm really is a good predictor of perceived distortion, but it can't be compared to THD and IMD when their own correlation values are so unreliable. So that would mean this study does not properly support the claim that THD and IMD are inferior and should be replaced with Gm.
You seem quite critical of the study, that's fine, that's what science is all about. So, when you do, or find, a study that is much better designed and shows a preference for THD or IMD, then I would love to see those results so that I can comment on them.
The fact is that there have been other studies that have shown the same results, but there isn't much interest in publishing non-event studies that don't say anything new. I know of one in particular done by Alex Voishvillo at JBL. He found the exact same results for THD and IMD that we did. He did not test Gm.
It's been almost 20 years now since that study and nothing contradictory has come about. In fact, I'd say that it kind of killed the interest level (at least professionally) in nonlinearities in loudspeakers. Less so for electronics, but they are, for the most part, completely linear anyways, so again, nonlinearity is not much of an issue.
I know of no professional in the audio business who still obsesses over THD or IMD. It seems to be unique among "audiophiles".
I have measured the GedLee distortion of a some woofer I am evaluating, see attached plot. What does that tell me? Is a GedLee gm value of 0.1 "good" or "bad"? What about gm = 1 or gm = 0.01?
In other words: are there any hints on the correlation of the GedLee gm value with the audibility of distortion?
In our original paper, which you should read at my website, a value of about 2.5-3.0 was deemed to be inaudible.
Everyone, please remember that our study was preliminary and never intended to be the end-all on the subject. Alas however, it is completely rational that nothing has been done to further our understanding. Nonlinearity is simply something that you design out, it's always possible to do. Our papers did give significant support for the contention that THD and IMD were pointless metrics to use since they clearly had weak correlations even to weak predictors (i.e. the IMD was mildly negative!!)
The original work was done only for a fictitious set of signals and systems and the correlation of this to subject response in the real world has never been validated. And why is that? Because there is simply no interest in doing so among people who do this kind of thing for a living. That has to tell you something! Toole never even mentions nonlinearity is his books - that's how important it is to him! I wrote the papers and I never went back to the subject afterwords.
In our original paper, which you should read at my website, a value of about 2.5-3.0 was deemed to be inaudible.
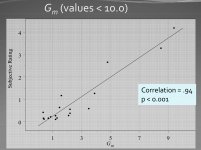
Ok, I looked at your website and found your presentation slides "The Perception of Distortion". This has some interesting comments and some charts comparing THD, IMD and Gm vs. subjective perceived distortion. While the THD and IMD data do not show any (substantial) correlation, the Gm metric does (at least in this dataset), and it nicely illustrates the answer to my original question. I attached a copy of this chart so that I (and others) may be able to find it again.
Attachments
Hi Mbrennwa
Did you see the original AES papers by Geddes and Lee on the Gedlee website?
http://www.gedlee.com/Papers/Distortion_AES_I.pdf
http://www.gedlee.com/Papers/Distortion_AES_II.pdf
(I have also updated the links in my original post.)
From the second paper (last page):
I was very interested to see the results in your chart. How did you calculate all the values of Gm? The many different values of Gm depending on frequency and amplitude illustrate an interesting aspect of the Gedlee metric. As it stands, the metric, strictly speaking, applies only to systems with static nonlinearity.
In section 2 of the first paper, "Nonlinear systems", the static or memoryless transfer function T(x) of a system is defined. T(x) "relates the instantaneous output level of some quantity versus the instantaneous input level of this same quantity". T(x) has no frequency dependence or memory in time and is a static nonlinearity. There is only one possible output level for a given instantaneous input level.
A defining characteristic of a system exhibiting static nonlinearity is that, given a sine fundamental H1 with a normalised phase of 0 degrees, the odd harmonics (resulting from the nonlinearity) will be sines having a phase shift of 0 or 180 degrees, and the even harmonics will be sines having a phase shift of +/- 90 degrees relative to the fundamental. The odd harmonics are in quadrature with the even harmonics.
The upshot of this is that if a system exhibits static nonlinearity, there is only one transfer function T(x) and consequently one value of Gm, valid for all frequencies and inputs. The characterisation and evaluation of such systems was the aim of the authors.
For systems with dynamic nonlinearity, on the other hand, there is more than one possible instantaneous output value for a given instantaneous input value, and the necessary pattern of odd and even harmonics in quadrature does not exist. A system with hysteresis is an example of a system with dynamic nonlinearity.
The Gm expression is not amenable to exact solution in the case of systems with dynamic nonlinearities. My Calc .ods spreadsheet attempts to "smooth out" any minor degree of dynamic nonlinearity to make a Gm calculation possible (though this was not possible with the Excel version). However, the Gm expression applied strictly fails in the case of systems exhibiting any degree of dynamic nonlinearity. Unfortunately, the reality, of course, is that real-life systems do not always (usually?) exhibit static nonlinearity; they exhibit dynamic nonlinearity.
Drs. Geddes and Lee were aware of this when they wrote the papers. The fact that loudspeakers in particular are characterised by dynamic nonlinearity is noted a number of times in the papers, and the hope is expressed that future research will find an efficient way to deal with systems in which Gm is frequency dependent.
It is unfortunate that the Gedlee metric has gained no traction since its inception in 2003. I understand the authors moved on to other areas of research long ago (and I understand why), and it would appear unlikely that something like the Gedlee metric applicable to systems with dynamic nonlinearity will appear any time soon. This is a shame, since we have no way to evaluate the audibility of different types and degrees of dynamic nonlinearity. It would be an interesting area to research - perhaps it's time for someone to take on this mantle and develop/propose a formulaic evaluation of sound quality as it relates to dynamic nonlinearity - but I'm not holding my breath. Deriving an expression for the transfer function that factors in variables such as time or frequency would appear to be a task of Herculean proportions. Any comments, Earl?
Stephen
Did you see the original AES papers by Geddes and Lee on the Gedlee website?
http://www.gedlee.com/Papers/Distortion_AES_I.pdf
http://www.gedlee.com/Papers/Distortion_AES_II.pdf
(I have also updated the links in my original post.)
From the second paper (last page):
The results indicate that systems where Gm < 1.0 can be expected to yield subjective ratings of “imperceptible” and that levels of Gm < 3.0 can be expected to yield subjective ratings of “barely perceptible but not annoying”.
I was very interested to see the results in your chart. How did you calculate all the values of Gm? The many different values of Gm depending on frequency and amplitude illustrate an interesting aspect of the Gedlee metric. As it stands, the metric, strictly speaking, applies only to systems with static nonlinearity.
In section 2 of the first paper, "Nonlinear systems", the static or memoryless transfer function T(x) of a system is defined. T(x) "relates the instantaneous output level of some quantity versus the instantaneous input level of this same quantity". T(x) has no frequency dependence or memory in time and is a static nonlinearity. There is only one possible output level for a given instantaneous input level.
A defining characteristic of a system exhibiting static nonlinearity is that, given a sine fundamental H1 with a normalised phase of 0 degrees, the odd harmonics (resulting from the nonlinearity) will be sines having a phase shift of 0 or 180 degrees, and the even harmonics will be sines having a phase shift of +/- 90 degrees relative to the fundamental. The odd harmonics are in quadrature with the even harmonics.
The upshot of this is that if a system exhibits static nonlinearity, there is only one transfer function T(x) and consequently one value of Gm, valid for all frequencies and inputs. The characterisation and evaluation of such systems was the aim of the authors.
For systems with dynamic nonlinearity, on the other hand, there is more than one possible instantaneous output value for a given instantaneous input value, and the necessary pattern of odd and even harmonics in quadrature does not exist. A system with hysteresis is an example of a system with dynamic nonlinearity.
The Gm expression is not amenable to exact solution in the case of systems with dynamic nonlinearities. My Calc .ods spreadsheet attempts to "smooth out" any minor degree of dynamic nonlinearity to make a Gm calculation possible (though this was not possible with the Excel version). However, the Gm expression applied strictly fails in the case of systems exhibiting any degree of dynamic nonlinearity. Unfortunately, the reality, of course, is that real-life systems do not always (usually?) exhibit static nonlinearity; they exhibit dynamic nonlinearity.
Drs. Geddes and Lee were aware of this when they wrote the papers. The fact that loudspeakers in particular are characterised by dynamic nonlinearity is noted a number of times in the papers, and the hope is expressed that future research will find an efficient way to deal with systems in which Gm is frequency dependent.
It is unfortunate that the Gedlee metric has gained no traction since its inception in 2003. I understand the authors moved on to other areas of research long ago (and I understand why), and it would appear unlikely that something like the Gedlee metric applicable to systems with dynamic nonlinearity will appear any time soon. This is a shame, since we have no way to evaluate the audibility of different types and degrees of dynamic nonlinearity. It would be an interesting area to research - perhaps it's time for someone to take on this mantle and develop/propose a formulaic evaluation of sound quality as it relates to dynamic nonlinearity - but I'm not holding my breath. Deriving an expression for the transfer function that factors in variables such as time or frequency would appear to be a task of Herculean proportions. Any comments, Earl?
Stephen
Hi Stephen
I am not quite sure what you mean by "static/dynamic nonlinearity".
I simply measured the transfer function using sine test signals at different frequencies and amplitudes. Since the harmonics depend on test frequency and level, the GedLee metric also shows the same dependency of test frequency and level.
The whole thing is implemented in MATAA.
Last edited:
This study goes a ways to explaining the kind of amplifier I like to build. That is those that will not produce higher orders of HD. There are some people that accuse the genre of producing a larger amount of lower orders.. but I am careful to minimise these at every turn. I feel vindicated by this study.
AllenB, it's no big news that higher order harmonics are more "disturbing to the ear" than lower harmonics. This has been known for many decades. The reason is that low harmonics are masked by the fundamental during sound perception in the ear, whereas higher harmonics are not. This is simply due the acoustical/mechanical workings of the ear (just google for it, you'll find good texts about this).
The question is what kind of weighting should be applied to judge "how bad" higher harmonics are. The GedLee metric is just one of many answers to that question.
The question is what kind of weighting should be applied to judge "how bad" higher harmonics are. The GedLee metric is just one of many answers to that question.
- Home
- Design & Build
- Software Tools
- The Gedlee Metric Demystified