I am not speaking about acoustic signals, but electronic circuits. And you can both measure and simulate phase angles of the distortion components and they are definitely not only 90° or 180°. Maybe in theoretical oversimplification yes, but not in the real world. The theory is only that good as close it approaches the reality, no more.
Active circuits could easily exhibit dynamic nonlinearities like hysteresis, (especially if designed to do that) but passive ones, especially ones that are designed to be linear, are highly unlikely to exhibit this kind of behavior.
That does not look like "the real thing" to me since it is a simulation. We have seen how some transfer characteristics (polynomials) can be multivalued, but that does not mean that these will be commonplace in real systems designed to be linear.
I know perfectly what it is, as the guy is from nearby and he tries to compensate for the distortion of the soundcard measuring channel. In the beginning I told him that he would need to compensate for phase angles of distortion components and he soon realized I was right and that it was not any easy task.
REW will show the phases of distortion components in its RTA distortion panel, there is an option for that in the RTA graph controls. On the earlier post about multi-valued output, that's the normal case for any system displaying hysteresis. Quite common behaviour in mechanical systems, not so sure what the equivalent behaviour in an electronic system would be.
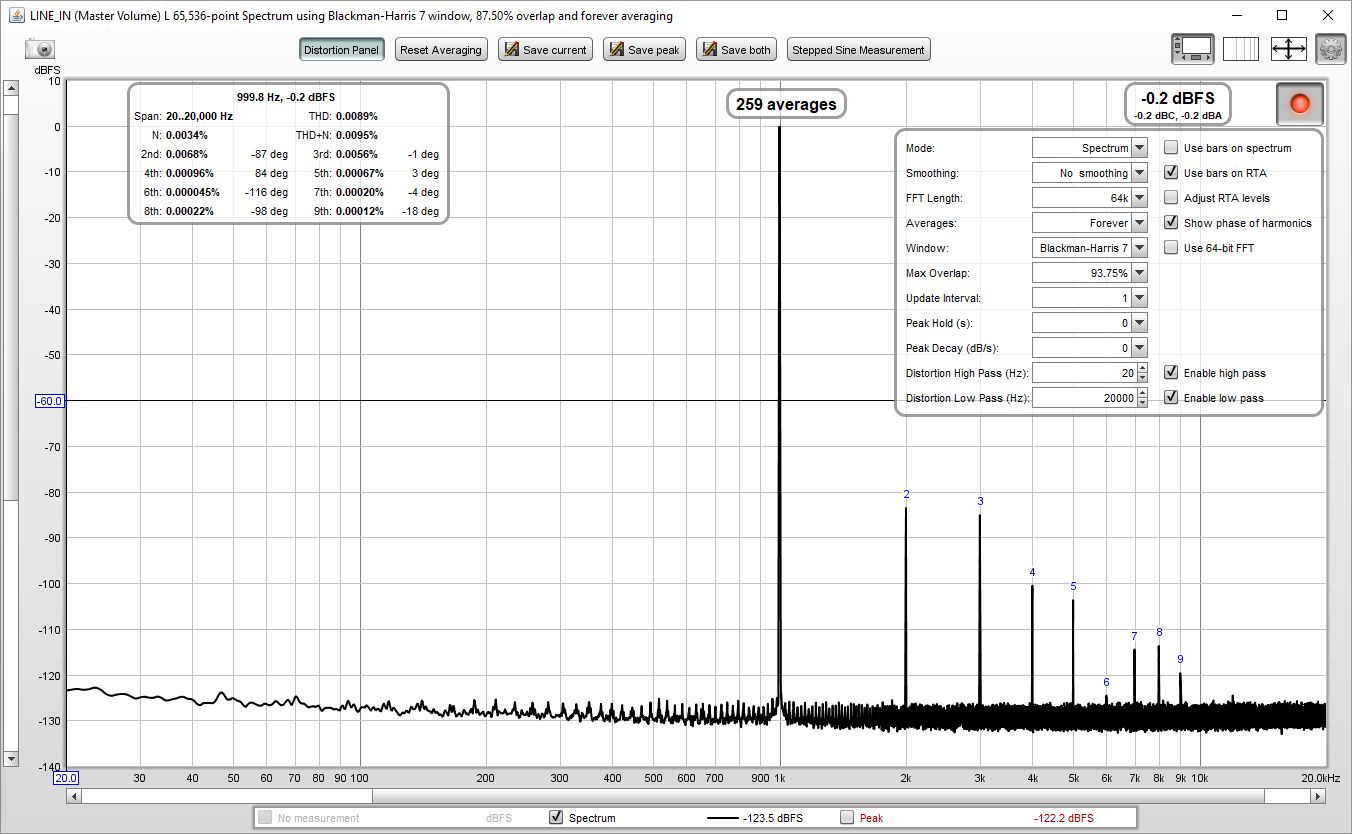
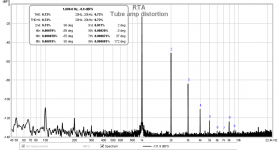
REW will show the phases of distortion components in its RTA distortion panel, there is an option for that in the RTA graph controls.
Yes, REW can do it. Attached is a measurement of a tube link stage that has no global feedback and most surely no hysteresis. Distortion components are close to 90° multiples if they are high enough (level). For small distortion components, phase reading starts to be random and differs from 90° multiples.
Attachments
Yes, I agree, though I suspect that the deviation from the ideal static case is usually small.
Why? (Not arguing, just wondering)
Partly because, looking at the results of .FOUR analyses in LTspice, one often sees that the odd and even harmonics of a distorted sinewave are nearly in quadrature, but not exactly so.
There are occasions when the harmonics are far from quadrature though, here is a loopback measurement of an old Edirol UA-1A card as an example. The harmonic phases change at different stimulus levels.

Edit: one might speculate that is a result of more than one harmonic contribution at a given harmonic frequency with differing (but quadrature) phases and unequal amplitudes.
Edit: one might speculate that is a result of more than one harmonic contribution at a given harmonic frequency with differing (but quadrature) phases and unequal amplitudes.
Last edited:
There are occasions when the harmonics are far from quadrature though...
Sure, I wouldn't disagree with this (which is why I used the word "often").
I plotted T(x) for your results. At these levels of distortion, to the eye, T(x) appears to show no nonlinearity. However, the plot of T(x) deviation (from the ideal case) shows two lines, and hence an element of dynamic nonlinearity.

Stephen
In the case of a loudspeaker, I am wondering, is the restoring force acting on a loudspeaker cone a source of dynamic nonlinearity? It seems to me that the force will impede the cone movement when the cone is moving away from its rest position, and assist the cone movement when it is moving towards its resting position. Does this not result in different responses for the rising and falling sections of the input waveform?
The restoring force is a spring. It always pulls towards the center. It is "mostly" linear, but at high excursions the restoring force tends to increase more than linear, which is a good thing to keep the cone from moving out of the gap. Please remember that not all nonlinearity is equally bad, some are in fact good things as they maintain better control over the cones motion. If they are gradual deviations from linear then they tend to be inaudible. It is rapid changes that lead to audible distortions. To wit crossover distortion in an amp is highly audible.
Edit: one might speculate that is a result of more than one harmonic contribution at a given harmonic frequency with differing (but quadrature) phases and unequal amplitudes.
This is possible as is a contribution from the noise. The noise may have a small effect on the harmonics amplitude, but a much larger effect on its calculated phase.
So we do have a few real-world examples where the phase angles of the harmonics are not in quadrature to the fundamental (either because that's how the DUT works, or because of measurement noise, or whatever). This means the transfer function reconstructed by summing the Fourier components can indeed be multi valued for a given input. How is the GedLee metric defined in this case? Which "branch" of the transfer function should be used for the calculation?
I think that the solution is obvious, just find the average curve and use that. Or, in other words, set the harmonics in quadrature and use that curve.
I haven't looked at this situation in any detail simply because I haven't seen this problem in the real world - not for loudspeakers at any rate, and any amp that exhibits this should be fixed.
I haven't looked at this situation in any detail simply because I haven't seen this problem in the real world - not for loudspeakers at any rate, and any amp that exhibits this should be fixed.
I think that the solution is obvious, just find the average curve and use that.
Averaging the two "branches" of the transfer function might cancel some of the nonlinearity. The average transfer function would therefore not always show the full distortion of the DUT.
Or, in other words, set the harmonics in quadrature and use that curve.
On what grounds would one do that? Because there are irrefutable physical principles that do not allow any other phase angles than quadrature? Or because the GedLee method does not work with non-quadrature systems as it is? No matter what the answer is, I don't like the idea of fudging observed data just to make it conform with the assumed "input format" for some analysis method. It is better to adapt the analysis method to work with as many real-world data as possible.
My suggestion would be to determine the GedLee metrics using both branches separately (Gm1 for the first "branch" and Gm2 for the second "branch"). I wouldn't be surprised if the two results were not very different due to some inherent symmetries in the combination of the GedLee weighting function and the trigonometry stuff (just a gut feeling, I haven't thought about this very much). If this turns out not to be the case (Gm1 ≠ Gm2; my gut feeling is usually not very reliable), one could axiomatically define the GedLee metric as some mean of Gm1 and Gm2, for example Gm = (Gm1+Gm2)/2 or Gm = sqrt(Gm1*Gm2).
Interesting to me:
All of this stuff is about systems or a chain of subsystems and the last subsystem is the nonlinear human with two ears and a brain.
In many of the GedLee studies the Device Under Test is the human. In large part the GedLee Metric is the weighting given to the input to the human subsystem.
The GedLee Metric was developed with computer generated transfer functions subjectively tested with human DUT’s.
Now that we have the GedLee Metric and know what the weighting is. We have a model of what is particularly obnoxious sounding to humans and what is not.
I am thinking that I want to replace the human with an APx555 analyzer and microphone. With this GedLee Metric in hand we can chirp CD’s + horn/waveguides, cones and domes or whatever (generate a transfer function). This GedLee Metric is the equivalent of a Distortion DNA Profile. If the offending alleles are present there in only one chance in 10,000,000 that the suspect CD + horn/waveguide will not sound particularly obnoxious to nonlinear human DUT’s.
Thanks DT
If the offending alleles are present there in only one chance in 10,000,000 that the suspect CD + horn/waveguide will not sound particularly obnoxious to nonlinear human DUT’s.
Thanks DT
I don't follow this line of thought.
Visually this is what our ears hear.
Now that we have the weighted GedLee Metric we know what orders of distortions are offensive to the human DUT. The highest weighted distortions are the worst offenders. Perhaps brain waves on an EEG would be more visually meaningful to you than the analogy of Alleles on a DNA barcode. Patterns that appear on a chart will catch the eye more than an abstract number labeled Gm.
Now we need a flashy color graphic to present to our industry clients (if you will). Present the flashy graphic and say “this is the distortion that our ears hear and respond to”. Next we explain that “our software can extract this simple number, Gm, on a scale of 1 to 10, 10 being the worst this is the distortion that our ears hear”. Short version; simplify the concept of HOM’s and masking to the point that even an architect can understand.
The work of producing the graphic would be next. Try several potential input stimuli; single tone, dual tone multi-tone, chirp sweep, run it through the analyzer, FFT, IMD, chirp with Bode plot and phase or whatever. Then using the math functions remove/minimize the lower order benign distortion products and make the offending Higher Order distortion products look big and menacing (graphically illustrate the weighting).
More than you asked for.
Thanks DT
I don't follow this line of thought.
Now that we have the weighted GedLee Metric we know what orders of distortions are offensive to the human DUT. The highest weighted distortions are the worst offenders. Perhaps brain waves on an EEG would be more visually meaningful to you than the analogy of Alleles on a DNA barcode. Patterns that appear on a chart will catch the eye more than an abstract number labeled Gm.
Now we need a flashy color graphic to present to our industry clients (if you will). Present the flashy graphic and say “this is the distortion that our ears hear and respond to”. Next we explain that “our software can extract this simple number, Gm, on a scale of 1 to 10, 10 being the worst this is the distortion that our ears hear”. Short version; simplify the concept of HOM’s and masking to the point that even an architect can understand.
The work of producing the graphic would be next. Try several potential input stimuli; single tone, dual tone multi-tone, chirp sweep, run it through the analyzer, FFT, IMD, chirp with Bode plot and phase or whatever. Then using the math functions remove/minimize the lower order benign distortion products and make the offending Higher Order distortion products look big and menacing (graphically illustrate the weighting).
More than you asked for.
Thanks DT
More than you asked for.
Thanks DT
True, but it still doesn't explain the phrase
But perhaps that was the intent.there in only one chance in 10,000,000 that the suspect CD + horn/waveguide will not sound particularly obnoxious to nonlinear human DUT’s
- Home
- Design & Build
- Software Tools
- The Gedlee Metric Demystified