Your confusing me 
Do you see the single text file that was in the zipped folder?
It should be slotted in somewhere amongst all the sims.
You only need that one file for all the sims to work.
If you can't see how it works then try this. The model file is called poundys models and the sim has been altered to suit.
Just extract the zipped folder and run the sim (it won't run from the zipped folder, you must extract the contents). Don't alter anything. The sim should run and it will take a few seconds to complete as it is a complex one. You can then see how it works and how the model file is identified.
Attachments
First my apologies if this has been handled in the previous messages of this thread - but I cannot find any information with internet search either.
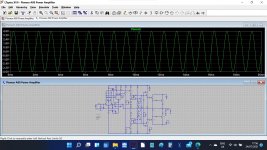
I stumbled across strange voltage values of the same signal when doing a simulation of Yamaha A-700 power stage (yes, with wrong component models but better these than nothing).
So I downloaded the zip file from
Installing and using LTspice IV (now including LTXVII). From beginner to advanced.
and tested it also on the Pioneer A80 model from there.
Same inconsistency appears - voltages in ac simulation are greatly different from voltages in tran simulation:

Am I doing something very wrong or thinking very wrong or using the software in a wrong manner here?
I stumbled across strange voltage values of the same signal when doing a simulation of Yamaha A-700 power stage (yes, with wrong component models but better these than nothing).
So I downloaded the zip file from
Installing and using LTspice IV (now including LTXVII). From beginner to advanced.
and tested it also on the Pioneer A80 model from there.
Same inconsistency appears - voltages in ac simulation are greatly different from voltages in tran simulation:
Am I doing something very wrong or thinking very wrong or using the software in a wrong manner here?
What is the problem you see?
240V as output on ac simulation plot seems strange.


.ac doesn't look at the actual circuit level capabilities. It simulates with the devices linearized around the DC point, really a very small signal, and the .ac level specified in the command is only used to set the scales of the graph.
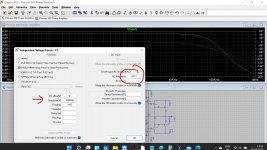
240V if you set the .ac at 1V only tells you that the gain is 240x, about 48dB. What is the gain of the amp?
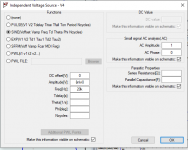
You set the test signal level for graphing in the top right corner see attachment.
Jan
240V if you set the .ac at 1V only tells you that the gain is 240x, about 48dB. What is the gain of the amp?
You set the test signal level for graphing in the top right corner see attachment.
Jan
Attachments
Last edited:
.ac doesn't look at the actual circuit level capabilities. It simulates with the devices linearized around the DC point, really a very small signal, and the .ac level specified in the command is only used to set the scales of the graph.
Ok, starts to make sense. So to have realistic values in amplifier ac analysis one should adjust the ac signal level so that the output voltage more or less matches the device actual (or designed) levels?
Regarding the gain of the amplifier - cannot tell, I just took the model from Mooly's package.
But technical specs are given for input sensitivity 150mV, power rails for output transistors seem to be around +/-60V.
Transient simulation shows that 150mV input corresponds to 35V output (P2P). Clipping (in the simulation) starts around 240mV input signal.
There is no 'right' or 'realistic' analysis level in .ac, it's a gain and phase versus frequency, you cannot draw any conclusions from it with regard to large-signal behavior.
You can set the level to 1kV, it won't change the graph one bit.
So 150mV for 35V output is a gain of 233, which very nicely matches the approximately 233V with 1V input in your graph ;-)
Jan
You can set the level to 1kV, it won't change the graph one bit.
So 150mV for 35V output is a gain of 233, which very nicely matches the approximately 233V with 1V input in your graph ;-)
Jan
Yes, that is crucial. OTOH, you also need to be aware of the limitations. The important thing about a .ac run is that it is strictly small signal, each device linearized around the DC bias point, so it cannot be used to test for any nonlinearity or distortion.
For that you need a .tran which is a large signal simulation using the actual signal levels you specify and exercising all non-linearities of the devices, insofar as they are part of the models.
For instance, it is not uncommon for say an opamp model not to simulate the current drawn from the V+ and V- pins, or not to simulate temperature dependence of the input DC offset. Know your model!
Jan
@ madis64
It's more common in an AC plot to set the Y-axis to display in decibels instead of volts. Right-click on the vertical axis and this will bring up a dialog box where you can set the Y-axis units. Choose "Decibel" instead of "Linear" or "Logarithmic." The value will still reflect the gain of the stage referenced to whatever AC signal level is applied to the input, but in decibels instead of volts.
Of course, there is no right or wrong way to display the results. LTspice gives you the choice.
The gain of the A80 (I used to own one) is high using as it does a 110k and 470 ohm the feedback network.
If you set the Analysis sim to show voltage and set the 'Small Signal AC Analysis' amplitude input to 0.017v then you should see 4v just as on the Transient run of the sim. The other setting of 17mv doesn't now apply for the AC analysis run. You can set the input to a million volts and it will still give the correct figure of 4 volts output as it uses the other entry for this function.
If you set the Analysis sim to show voltage and set the 'Small Signal AC Analysis' amplitude input to 0.017v then you should see 4v just as on the Transient run of the sim. The other setting of 17mv doesn't now apply for the AC analysis run. You can set the input to a million volts and it will still give the correct figure of 4 volts output as it uses the other entry for this function.
Attachments
It's more common in an AC plot to set the Y-axis to display in decibels instead of volts.
I know
The volts just came into the play when we (in one local forum discussion) started to wonder about very high (abnormal) voltages in the simulation results.
And since I have been doing these simulations only for a relatively short time then I just swapped the Y-axis scale to volts to see actually what was presented.
Thanks for the advice anyway.
Mooly, also thanks.
While we are "at it" - what is the preferred way of getting tansient and ac analysis results simultaneously displaid? Open two copies (separate files) of same model and run one simulation from each of them? Or is there a way to get results from both simulations when using only one opened model?
While we are "at it" - what is the preferred way of getting tansient and ac analysis results simultaneously displaid? Open two copies (separate files) of same model and run one simulation from each of them? Or is there a way to get results from both simulations when using only one opened model?
There are plot panes in the waveform window available, why not add functionality to display results from different analysis of the same model in different panes?
It would guarantee that - when using all kinds of .step parameters - sims would be run with the same set of values.
It would guarantee that - when using all kinds of .step parameters - sims would be run with the same set of values.
- Home
- Design & Build
- Software Tools
- Installing and using LTspice IV (now including LTXVII), From beginner to advanced