Ah, I see what you mean.... the electrical response. Yeah, that looks like a bug. As a workaround for now, you could set the drivers's response temporarily to a flat line (same dB all freqs, like go to select and FRD file but then Cancel rather than Open) and mute any other drivers. Won't directly show you voltage loss, but you can scale it to match the visible Filter Response graph.
Will put that on the "to fix" list for if I get to that.
Will put that on the "to fix" list for if I get to that.
Hi Pano guess you know what you doing in its the electrical response you trying to export there ") but if its important and you can live without its belonging phase then another alternative is take snapshot to picture-file "Large" and use FPGraphTracer to trace frd-file.
but if its important and you can live without its belonging phase then another alternative is take snapshot to picture-file "Large" and use FPGraphTracer to trace frd-file.
Link: FPGraphTracer : fprawn labs
but if its important and you can live without its belonging phase then another alternative is take snapshot to picture-file "Large" and use FPGraphTracer to trace frd-file.Link: FPGraphTracer : fprawn labs
Last edited:
Bill,
I guess this is the right spot for Xsim feedback.
I just started using it after years with Jeff's PCD.
I run Ubuntu, and it got to be a chore to spin up a VirtualBox session just to run some sims. Xsim runs pretty great on Linux using "PlayOnLinux".
No major problems with the prog.
Love the way you can center the FR scale, and love the way you can easily change the unit dB values per divisor if you want to drill in (or out).
It's pretty awesome to be able to create arbitrary crossover topologies.
Couple of nits.
It would be nice to be able to scale an arbitrary FRD file up and down (dB level) -
either during import or just during a "Tune".
My prints of the crossover window work fine, but include a grey(ish) background and the grid dots. I would like to have a blank background and heavier lines for the crossover.
As it is, I currently screencap that window and save it in my project documentation folder.
Driver/Baffle basic Geometry would be nice. Just the basics - X/Y/Z offsets of the drivers.
Thanks for a very "cool" and useful program!
I am now starting to use Xsim and would like to use the parameters for some special spkrs I know well.... how can I build/edit the FRD files ?
Pretty much have to measure them, unless you can find ZMA or FRD files for them. Many of the Dayton drivers at Parts Express provide such files (with delays set as if they were all on the same flat baffle). But for most drivers you will need to get some measurement gear.
It would be nice to be able to scale an arbitrary FRD file up and down (dB level) -
either during import or just during a "Tune".
That's not supported now, but you could instead shift the dB level of the simulated response (for comparing to the FRD file curve display) by simply Tuning the power level on the Power Amp symbol!
My prints of the crossover window work fine, but include a grey(ish) background and the grid dots. I would like to have a blank background and heavier lines for the crossover.
How are you printing? Grid dots shouldn't be there (I don't see them when I print here)?
Maybe try this: File -> Snapshot -> To Picture File -> As Shown, then save as type .png
Open the png file in PaintBrush (or other graphics app) and print from there. Should be crisp and clear, no dots or smearing. (you could also save as a .pdf file, to be even more clear, but then you have to load Adobe to print).
or: File -> Snapshot -> To Windows Clipboard -> As vector graphic; and then paste it into your graphics app (such as Clipboard)
Pretty much have to measure them, unless you can find ZMA or FRD files for them. Many of the Dayton drivers at Parts Express provide such files (with delays set as if they were all on the same flat baffle). But for most drivers you will need to get some measurement gear.
Can I do it with ARTA ?
Probably (I'm not familiar with ARTA, but I think that's one of its purposes). Just make sure to include phase information and relative delay as well. Here is a short writeup I did (coincidentally just yesterday) outlining how this would be done with a 3-way:
____
For a three-way, measure the following (keeping the microphone position, the baffle position, and the levels the same for all measurements -- WITH phase response included):
**Tweeter response
**Tweeter + Midrange response (both together, no crossover)
**Midrange response
**Midrange + Woofer response (both together)
**Woofer response
Then, make an XSim design model with nothing but three drivers connected in parallel together to the power amp. "Tune" the top one to have the Tweeter's FRD file; the middle one to have the Midrange's FRD file; and the bottom one to have the Woofer's FRD file. (You don't need to bother with impedance files at this point until you do actual crossover designing)
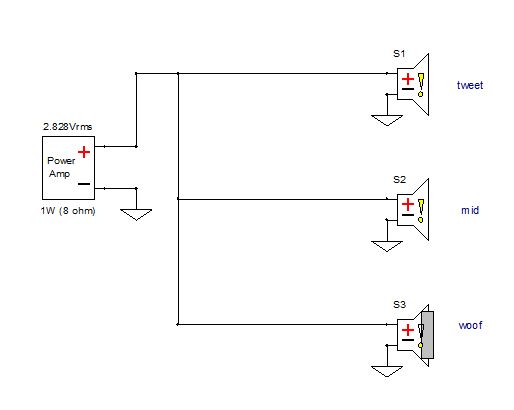
Mute out the woofer to start. You should see in the Frequency Response plot the simulated effect of the tweeter and midrange both playing together, which is the situation of the 2nd measurement you made above. In that Frequency Response plot, use its "Curves" menu to "Get File" and load the actual measured combined "Tweeter + Midrange" response. The idea is to compare this to simulated. "Tune" the midrange driver's "Mod delay" until the simulated response very closely resembles the measured combined response.
Next, unmute the Woofer and mute the Tweeter. Change the "Get File" to the combined "Midrange + Woofer" response FRD file. Tune the WOOFER's "Mod delay" value till the simulated closely matches that curve. Don't touch the midrange's or tweeter's "Mod delay" values, since you previously aligned them together. Now you have all the response files loaded to the proper drivers, with the actual relative delays established between them all. You can load your measured impedance files now, detach the drivers in the model from each other, and begin designing/simulating your crossover. The simulated results you get should essentially EXACTLY agree with what you will get when you build the actual designed crossover.
____
If your ARTA setup measures absolute phase (is "time locked" and uses a soundcard that can do that right), and can produce FRD file format, you could just measure to make files and go. The 'combined' measurements and delay adjustments are when the time isn't locked, as with Omnimic (Omnimic is designed to not need any cables between the measuring system and what is being measured).
____
For a three-way, measure the following (keeping the microphone position, the baffle position, and the levels the same for all measurements -- WITH phase response included):
**Tweeter response
**Tweeter + Midrange response (both together, no crossover)
**Midrange response
**Midrange + Woofer response (both together)
**Woofer response
Then, make an XSim design model with nothing but three drivers connected in parallel together to the power amp. "Tune" the top one to have the Tweeter's FRD file; the middle one to have the Midrange's FRD file; and the bottom one to have the Woofer's FRD file. (You don't need to bother with impedance files at this point until you do actual crossover designing)
Mute out the woofer to start. You should see in the Frequency Response plot the simulated effect of the tweeter and midrange both playing together, which is the situation of the 2nd measurement you made above. In that Frequency Response plot, use its "Curves" menu to "Get File" and load the actual measured combined "Tweeter + Midrange" response. The idea is to compare this to simulated. "Tune" the midrange driver's "Mod delay" until the simulated response very closely resembles the measured combined response.
Next, unmute the Woofer and mute the Tweeter. Change the "Get File" to the combined "Midrange + Woofer" response FRD file. Tune the WOOFER's "Mod delay" value till the simulated closely matches that curve. Don't touch the midrange's or tweeter's "Mod delay" values, since you previously aligned them together. Now you have all the response files loaded to the proper drivers, with the actual relative delays established between them all. You can load your measured impedance files now, detach the drivers in the model from each other, and begin designing/simulating your crossover. The simulated results you get should essentially EXACTLY agree with what you will get when you build the actual designed crossover.
____
If your ARTA setup measures absolute phase (is "time locked" and uses a soundcard that can do that right), and can produce FRD file format, you could just measure to make files and go. The 'combined' measurements and delay adjustments are when the time isn't locked, as with Omnimic (Omnimic is designed to not need any cables between the measuring system and what is being measured).
You can use ARTA, HOLMImpulse or REW among other to give you the FRD files you want. Don't forget the impedance files! ZMA
Yup (but don't forget Omnimic too!). Easiest way to measure for ZMA file is the DATS or a Woofer Tester.
That's not supported now, but you could instead shift the dB level of the simulated response (for comparing to the FRD file curve display) by simply Tuning the power level on the Power Amp symbol!
How are you printing? Grid dots shouldn't be there (I don't see them when I print here)?
Maybe try this: File -> Snapshot -> To Picture File -> As Shown, then save as type .png
Open the png file in PaintBrush (or other graphics app) and print from there. Should be crisp and clear, no dots or smearing. (you could also save as a .pdf file, to be even more clear, but then you have to load Adobe to print).
or: File -> Snapshot -> To Windows Clipboard -> As vector graphic; and then paste it into your graphics app (such as Clipboard)
I'm running on Ubuntu using the PlayOnLinux utility.
XSim itself runs very well - I suspect that the printout function is messed up somewhere between PlayOnLinux apis and Linux. Please don't worry about it.
Not a biggie for me.
There's a new update of Xsim now up -- http://libinst.com/Xsim/XSimSetup.exe
Mostly some bug fixes, a few new things -- derive a driver's impedance phase from only the magnitude of a ZMA file (so you could just make a curve from points read off a manufacturer's data sheet) The "file" curve in the Frequency Response phase can now be offset up or down with a dB offset scale control. Curve colors changed a bit for better visibility. Some hint bubbles pop up to show new users how to do some non-obvious functions (the hints can be turned off).
Note: Xsim has (even before the update) an "auto-updater", which I found out is HATED by the antivirus program Avast! Apparently Xsim's wanting to go out on the net to download the update gives Avast a scare. You might have to turn off your antivirus program for a few minutes to let it complete if your current install of Xsim tries to do its own update and your antivirus is particularly intrusive.
Last edited:
- Home
- Design & Build
- Software Tools
- XSim free crossover designer