I tested some months ago, with early versions of Win10, no problem on my computer(s), just install and run!
This Win10 machine lacks a loopable audio interface for more complete testing right now, but it starts and brings up its menus just fine.
Barleywater
The key point of this exercise is to create a phase plot for a real driver using test methods without assumptions.
..and it wasn't obvious to you by inspection that any real world measurement relies on any number of assumptions?
Hi Sumaudioguy,
Please excuse me for joining the party so late, but if I wanted to put some code together to make the test you describe, should I sum both phase locked signals, 100Hz and 200Hz together before applying them to the speaker? Am I interpreting your test setup in the first paragraph of your post No.949 correctly?
If not I would be grateful if you could advise where I am going wrong.
Peter
Yes Just like West Virginia. It's all relative.
Was simply curious about what would happen if the peak is locked to time zero. Since the peak of the impulse is mostly the highest frequencies of the measurement, what does that do to the relative phase of the drivers. It's relative, but relative to what? Seems it doesn't matter. It works.
This afternoon I set up measurement and locked the time to the soundcard loop-back. That took the latency out of the measurement. Then ran a sweep. The impulse offset was 7.5 meters. Guess how far the mic was from the speaker.
That 7.5 meters is highly unlikely choice for your microphone, I ran measurements with microphone 2cm from dust cap of 12" woofer in sealed enclosure using both HOLM and REW.
With REW, two channel loopback of soundcard was used for reference. Results look quite believable.
With HOLM a reference loopback was made with settings for largest peak placed at t=0. Time lock was then set using sample offset found for reference measurement. Then time locked loopback measurement of soundcard was made with peak appearing slightly before t=0. A second measurement gave same result:

The rising phase response at high frequencies is clearly not correct. Clearly instability of computer or software is in play. Nonetheless, I proceeded with 2cm measurement of woofer and got woofer impulse response at about 28 meters!
I closed HOLM and pondered what results would happen rerunning the experiment.
Take two:

Expectation of loopback with time lock having peak at t=0 is still not met.
Take two of woofer measured at 2cm:

Peak appears at 12cm, and result appears identical to measurements made with REW.
Measurements were made at 44.1kHz sample rate. With speed of sound taken as 341m/s this works out to about 2.6 samples/2cm of sound travel. Here are copies of 2cm woofer measurement with 3 and 6 sample offsets in comparison with original measurement and zoom of associated phase plots:

The six sample offset is an approximation for the distance from microphone to the junction of voice coil former and driver cone. Results show range of frequencies that may include actual woofer phase.
Barleywater,
I am not following your experiment.
Are you saying that a time lock in Holm does not result in an identical peak location (and hence non-identical phase) in subsequent measurements?
If so, there is a known situation regarding the lock setting processes and also limitations of for some computers. Do not hit 'enter' after entering an adjusted offset value as that restarts the stream, often with a new latency. Even avoiding 'entering' a new offset I often experience a minor slip on the first measurement after an offset change. Even using the correct process of locking the time on a 'stable' computer it can still result in a minor time slip occasionally by about the amount shown in your first chart and also in the 2nd chart in Post 889. At least that is true on my current setup. That is why it is a good idea to confirm the repeatability of measurement after setting the lock and then not changing the setting it until the session is completed. It is best to also occasionally recheck that there has been no slippage even during a longer session by repeating the original measurement. On my older/slower PC the time lock sometimes slipped by large amounts. After confirming the lock is set and repeatable then normally a session of driver alignment can be completed without any slippage and can be repeated with the same results in either the same or future sessions.
If occasional time lock slippage is not your finding, then I misunderstood the issue you raised.
To measure time of flight we could set the time lock with the mic at the baffle plane on the TW axis. Confirm the repeatability of the lock, then move the mic to the listening position for the 2nd measurement. Finally move the mic back to the baffle plane for a measurement to confirm there was no time lock slippage. The distance and also the overall phase trend of the TW should be identical when accounting for the various room reflections at sistance. I can do this to test my expectation if there is a question. In my small room I find it easier to use a tape measure.")
I am not following your experiment.
Are you saying that a time lock in Holm does not result in an identical peak location (and hence non-identical phase) in subsequent measurements?
If so, there is a known situation regarding the lock setting processes and also limitations of for some computers. Do not hit 'enter' after entering an adjusted offset value as that restarts the stream, often with a new latency. Even avoiding 'entering' a new offset I often experience a minor slip on the first measurement after an offset change. Even using the correct process of locking the time on a 'stable' computer it can still result in a minor time slip occasionally by about the amount shown in your first chart and also in the 2nd chart in Post 889. At least that is true on my current setup. That is why it is a good idea to confirm the repeatability of measurement after setting the lock and then not changing the setting it until the session is completed. It is best to also occasionally recheck that there has been no slippage even during a longer session by repeating the original measurement. On my older/slower PC the time lock sometimes slipped by large amounts. After confirming the lock is set and repeatable then normally a session of driver alignment can be completed without any slippage and can be repeated with the same results in either the same or future sessions.
If occasional time lock slippage is not your finding, then I misunderstood the issue you raised.
To measure time of flight we could set the time lock with the mic at the baffle plane on the TW axis. Confirm the repeatability of the lock, then move the mic to the listening position for the 2nd measurement. Finally move the mic back to the baffle plane for a measurement to confirm there was no time lock slippage. The distance and also the overall phase trend of the TW should be identical when accounting for the various room reflections at sistance. I can do this to test my expectation if there is a question. In my small room I find it easier to use a tape measure.
But that's where it was. At the listening position, 7.5 meters from the speaker.That 7.5 meters is highly unlikely choice for your microphone,
HOLM nailed it.
Hi Sumaudioguy,
Please excuse me for joining the party so late, but if I wanted to put some code together to make the test you describe, should I sum both phase locked signals, 100Hz and 200Hz together before applying them to the speaker? Am I interpreting your test setup in the first paragraph of your post No.949 correctly?
If not I would be grateful if you could advise where I am going wrong.
Peter
The idea is to know the exact time character of the signal applied to the driver at two frequencies. As example, if the zero crossing of the 100Hz signal and 200Hz signal are at the same time in the applied signal then, assuming a driver with zero phase shift between 100Hz and 200Hz will produce, other than distortion products(HD & IM), an essentially identical signal. If the 200Hz signal arrives at a different time than the 100Hz signal then that time difference is directly related to the phase response of the driver. Let us say the zero crossing of the 200Hz signal is delayed 1ms for convenience. A 200Hz signal has a period of 5ms. 1ms divided by 5ms is 0.2. 0.2 multiplied by 360 degrees per period gives 72° of phase shift between the 100Hz signal and the 200Hz signal. This is a single point of the phase shift character of the speaker under test. The 1ms above would either be 1ms after or 1ms before the reference of the 100Hz signal indicating positive or negative phase in relation to the reference signal.
The 100Hz is always used as a reference signal in a simple test with all other frequencies being compared to the reference. As a slight modification, the test frequency of 200Hz could be used as the new reference frequency for a 300Hz measurement which MUST include for 300Hz the time difference of the 200Hz signal from the previous 100Hz/200Hz pair measurement because that time (1ms above) is already applied to the "new" 200Hz test signal. When plotted, all times are referenced to the 100Hz signal. Hope that makes sense.
These type of variations (having the new reference frequency be the previous test frequency) in the test procedure allow two tone method to measure phase response very accurately over very wide bands. This also allows for a certain amount of convenience when measuring using something like an oscilloscope instead of ending up trying to measure the phase response using a reference of 100Hz while determining phase at 10kHz. There would be 100 zero crossings in there and it could be the wrong 10kHz zero crossing selected of the 100 between a single cycle of the 100Hz reference. Moving the reference frequency helps alleviate this error. When drivers flip phase response the ability to determine which zero crossing is the correct one can be very difficult.
Thanks for trying! It is great someone is actually bothering to do so real testing.
wintermute, it is possible for HOLM to occasionally correctly measure phase almost by purely accident but, not by design. I have a few drivers here which stay in a single phase over almost two decades. There are many (most drivers) not able to stay in a single phase over two octaves no matter what bandwidth is selected. They spin phase like a top. They also sound bad to me, really bad. All the drivers I use stay in a single phase. As example, the one speaker I used for years showed a total of 180 degrees of phase shift from 50Hz to 20kHz as a smooth almost perfectly strait line. There are quite a few owners claiming this speaker is in a class by itself.
ARNYK- I have already addressed this like four times. Please bother to read the thread and not just start spouting blather cluttering the thread based in not bothering to read the thread.
PANO- A test device can be very precise and horribly inaccurate at the same time. Does this battery testing work with a horn as a curiosity? Probably not. Further, I have tested a load of midrange drivers which were easy to battery test to determine the "positive battery polarity" of the driver. Several of those same drivers, an octave and a half above the resonance frequency, tested negative phase response in the useful band to some dozens or more degrees. I even had a 15 inch cheap woofer that battery tested positive and phase tested negative at 50Hz. The cone was in total flop moving in the opposite direction of the voice coil. 2nd order drum head mode response. I cannot answer your polarity question in truth because I do not know. What I do know is the phase plots of HOLM are almost always wrong with that being my key point. I believe it is highly possible for HOLM to error on polarity also in some cases due to the method used could provide for an error of this measurement also.
Barleywater- I appreciate your efforts! Testing a driver at 2cm is probably not extremely useful. Other testing I have done shows a lot of unexpected things can happen very near the cone of the driver. Just a little further out all these different things combine to become a more, for lack of a better term, "even" or continuous wavefront in front of the driver. From a bunch of that testing, I never test a cone driver closer than the diameter of the basket. I recall a 10" cone woofer which I plotted the radiation pattern right next to the cone (really close to your 2cm) and then backed out 1cm and plotted again. Repeating this every cm. At 2 cm and the test frequency of 100Hz there were three distinct lobes near the cone. At 25cm all signs of three lobes disappeared with only the one smooth spherical wavefront seen as expected and pontificated by many. Getting to close does not work always. I just do not and instead use the above rule.
jcx- Well, for frequency test yes. To measure phase response not nearly so much so. Outdoor testing would be preferred for several reasons however, with a single driver (single acoustic source) in the room the phase of the output signal will not be changed by the room because, that single driver is the stimulating signal for any resonances present so the stimulating phase would not vary. If a reflection interacted with the driver the waveform seen on the detection (microphone) end would be really messed up and obvious there was something amiss. A good clean detected test signal very strongly suggest a useable test signal.
Still Confused about Two Tone
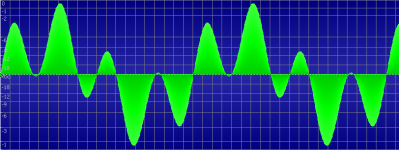
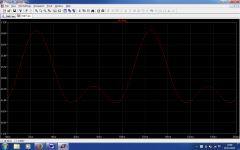
Sorry, but can you clear something up about the test? Are the tones played together, or separately? If together, how do you determine which tone is crossing where? See below for a 100Hz and 400Hz sine waves mixed together. How do you interpret where the different crossing points are?
If separate runs, how do you align the start points?
Attachments
I'm thinking played separately and then overlayed. I also think I now understand the confusion.
It may well be that Holm doesn't accurately show the phase (if the two tone test is the reference for accuracy). BUT for the purposes of simulating the crossover, provided the phase is consistent between the two drivers (ie the relative phase we have been mentioning), THEN the simulation will work just fine. I believe that holm is consistent in this respect.
Crossover sims work just fine if you do a hilbert transform to get minimum phase provided you have the correct driver offsets (x, y, z) in the model. I've done both, and compared the actual vs simmed too with very close matching.
So I guess what my point is, that sumaudioguys method is useful for sorting excellent drivers from mediocre drivers, but if someone is only interested in doing a simulation of a crossover, that will give very close to real world results, measurements done with holmimpulse should work just fine.
One other thing I have found that different hardware can give quite different results in loopback, especially when it comes to phase response (ie the soundcard itself can be very non-linear WRT phase). Calibration will help this, but can be an issue (Win7 64bit I have been unable to successfully calibrate without the system crashing).
Tony.
Hi Sumaudioguy,
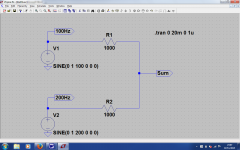
Thanks for your response. So, hypothetically speaking, if I connect the outputs of two phase locked oscillators, one at 100Hz and the other at 200Hz together, via two 1K resistors, with the junction of these two resistors applied to the input of the power amplifier that powers the loudspeaker under test, I would be all set to run the test you describe – yes?
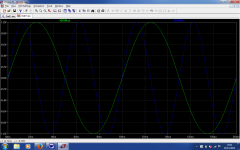
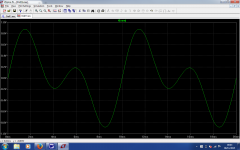
I entered this circuit structure into a Spice simulator as shown in Fig1 attached, but without the power amplifier. When I run the simulator, it shows the two generator waveforms as in Fig2. If I now plot the sum of these two generators that appear at the junction of the two resistors, I get Fig3, which is the signal that is effectively applied to the loudspeaker via the power amplifier.
This is also the same shape of signal that appears at the output of the microphone, assuming the speaker+microphone combination do not have any significant magnitude and phase distortion. But the zero crossings on this waveform, do not seem to indicate that the 200Hz generator is in phase with the 100Hz generator.
If I were to reduce the voltage of the 200Hz generator by 3dB and change the phase to –90 degrees, the summed output would be as shown in Fig4, which appears to show even less info about the phase relationship between the two generators.
Please let me know what I am missing.
Peter
Thanks for your response. So, hypothetically speaking, if I connect the outputs of two phase locked oscillators, one at 100Hz and the other at 200Hz together, via two 1K resistors, with the junction of these two resistors applied to the input of the power amplifier that powers the loudspeaker under test, I would be all set to run the test you describe – yes?
I entered this circuit structure into a Spice simulator as shown in Fig1 attached, but without the power amplifier. When I run the simulator, it shows the two generator waveforms as in Fig2. If I now plot the sum of these two generators that appear at the junction of the two resistors, I get Fig3, which is the signal that is effectively applied to the loudspeaker via the power amplifier.
This is also the same shape of signal that appears at the output of the microphone, assuming the speaker+microphone combination do not have any significant magnitude and phase distortion. But the zero crossings on this waveform, do not seem to indicate that the 200Hz generator is in phase with the 100Hz generator.
If I were to reduce the voltage of the 200Hz generator by 3dB and change the phase to –90 degrees, the summed output would be as shown in Fig4, which appears to show even less info about the phase relationship between the two generators.
Please let me know what I am missing.
Peter
Attachments
Last edited:
...jcx- Well, for frequency test yes. To measure phase response not nearly so much so. Outdoor testing would be preferred for several reasons however, with a single driver (single acoustic source) in the room the phase of the output signal will not be changed by the room because, that single driver is the stimulating signal for any resonances present so the stimulating phase would not vary. If a reflection interacted with the driver the waveform seen on the detection (microphone) end would be really messed up and obvious there was something amiss. A good clean detected test signal very strongly suggest a useable test signal.
my understanding is that sealed box woofers are reasonably modeled as velocity sources - the external radiating SPL has less influence on the diaphragm motion compared to internal mass-spring mechanical Z
and typical measurement mics are Omni pressure sensing types
phase shift is seen when driving resonant circuits with one type source and measuring the other of the across/through, pressure/velocity, voltage/current pair
You need a better soundcard or driver, Tony!
Funny you should say that, as I decided to do some tests to demonstrate what I was talking about.. previously my focusrite 2i2 gave the closest to flat phase of any of the three sound cards I can use. The audigy II ZS was the worst and the on board sound was not much better. I've just done loopbacks of all three, and now the audigy and on board sound are almost perfect, and the focusrite 2i2 is as it always has been....
I suspect that the direct sound drivers have improved, and that the asio driver for the 2i2 is not so crash hot. I unfortunately don't have asio drivers for the other two, and the 2i2 only works with asio.
One interesting thing, both the audigy and the on board require me to invert the measured signal, the focusrite doesn't.
Tony.
Attachments
OK I checked and didn't have the latest version of the 2i2 driver. I installed it and it didn't make any difference to the phase response... However what it did make a difference on is that I was able to successfully calibrate the card without it crashing on me! Below is the calibrated measurement using the focusrite 2i2. Note that all the previous measurements were uncalibrated.
Just have to hope that it keeps on working with the calibration file!
Tony.
Just have to hope that it keeps on working with the calibration file!
Tony.
Attachments

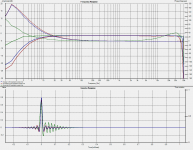
Checking HOLM phase results against sine waves at 100Hz and 200Hz:
A full bandwidth sweep is used to measure loopback response of soundcard that has typical high pass filtering due to capacitive coupling of output and input stages.
HOLM export impulse response is used to save waveform starting from 10000 samples before t=0, and ending 65536 samples beyond.
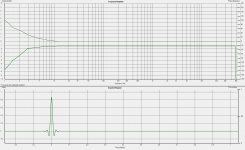
HOLM software in Manipulation tab provides division function labeled as C=A/B. This divides the spectrum of A with the spectrum of B, and transforms result into an impulse response in time domain. When A=B the result is single sample of high magnitude at t=0 surrounded by samples of zero magnitude; this is Dirac function with flat spectrum with zero degrees phase throughout. This is also exported with 10000 sample before t=0, and ending 65536 samples beyond.
The phase plot for loopback measurement is zoomed in on at 100Hz to read off phase with result appearing to be about 5.885 degrees. Zooming in on plot at 200Hz shows phase at about 3.185 degrees.
The two saved impulse responses are opened in Cool Edit.
Stereo tracks of several seconds duration are created. One is made with 100Hz tone, and a second track is made with 200Hz tone. The left channel of each track is convolved with the loopback impulse response and the right channel of each track is convolved with the Dirac function impulse response. The result in each case is a stereo track where the zero crossings of left and right channel do not line up. For each stereo track time is zoomed in until little more than a single wavelength is viewed. Next the amplitude is zoomed in on until zero crossings appear as single pixel wide vertical lines. Measurements of distance between zero crossings for left channel and right channel are made, and distances for zero crossings of single wavelength are made. Pasting screen shots from Cool Edit display into Photoshop where distances may be readily displayed in pixels conveniently does this. The ratio of pixel offset of zero crossings between channels with number of pixels per wavelength multiplied by 360 degrees per wavelength gives the angular displacements.
Results:
100Hz is 5.86 degrees, 0.43% difference from HOLM display.
200Hz is 3.21 degrees, 0.78% difference from HOLM phase display.
A full bandwidth sweep is used to measure loopback response of soundcard that has typical high pass filtering due to capacitive coupling of output and input stages.
HOLM export impulse response is used to save waveform starting from 10000 samples before t=0, and ending 65536 samples beyond.
HOLM software in Manipulation tab provides division function labeled as C=A/B. This divides the spectrum of A with the spectrum of B, and transforms result into an impulse response in time domain. When A=B the result is single sample of high magnitude at t=0 surrounded by samples of zero magnitude; this is Dirac function with flat spectrum with zero degrees phase throughout. This is also exported with 10000 sample before t=0, and ending 65536 samples beyond.
The phase plot for loopback measurement is zoomed in on at 100Hz to read off phase with result appearing to be about 5.885 degrees. Zooming in on plot at 200Hz shows phase at about 3.185 degrees.
The two saved impulse responses are opened in Cool Edit.
Stereo tracks of several seconds duration are created. One is made with 100Hz tone, and a second track is made with 200Hz tone. The left channel of each track is convolved with the loopback impulse response and the right channel of each track is convolved with the Dirac function impulse response. The result in each case is a stereo track where the zero crossings of left and right channel do not line up. For each stereo track time is zoomed in until little more than a single wavelength is viewed. Next the amplitude is zoomed in on until zero crossings appear as single pixel wide vertical lines. Measurements of distance between zero crossings for left channel and right channel are made, and distances for zero crossings of single wavelength are made. Pasting screen shots from Cool Edit display into Photoshop where distances may be readily displayed in pixels conveniently does this. The ratio of pixel offset of zero crossings between channels with number of pixels per wavelength multiplied by 360 degrees per wavelength gives the angular displacements.
Results:
100Hz is 5.86 degrees, 0.43% difference from HOLM display.
200Hz is 3.21 degrees, 0.78% difference from HOLM phase display.
- Home
- Design & Build
- Software Tools
- HOLMImpulse: Measuring Frequency & Impulse Response