I think you have it correct, you can use the ETC window to see if you might have any reflections that are corrupting/confusing the CSD plot. I agree that the spectrogram may make it easy to identify reflections than the ETC…also providing the frequency range that is affected by it. The ETC is a hold-over from the early days, but many who grew up with it still find it useful. Interesting article here: AES E-Library >> Uses and Abuses of the Energy-Time Curve…In my limited understanding I have been using the waterfall window BUT I always switch to the energy storage window to see whats a reflection and what isnt. Am I getting that right? At least in a limited way ha…Actually looking again at your posts it looks like the spectrogram may be the easiest to "see" if something is a reflection?
BTW, can you tell me(or post a screen shot) what settings are available for the CSD plot in OmniMic? The manual doesn’t seem to discuss or show them.
Hmmmm…interesting. That would suggest it is related to early reflections rather than a feature of the transducer itself. The smooth nature of it is what is confusing me. I'll take a closer look at the measurement you posted.Yes its running dipole. Further in the room the peak is less.
Apologize for the delay, but will not be able to get to the setting trends till later this weekend. In the meantime, attached is a gentle description of how the CSD plots are generated. A lot of good information there…but trend plots always make things more clear in my mind.…looking forward to the post with the settings ! really helpfull stuff !
Attachments
Hmmmm…interesting. That would suggest it is related to early reflections rather than a feature of the transducer itself. The smooth nature of it is what is confusing me. I'll take a closer look at the measurement you posted.
Apologize for the delay, but will not be able to get to the setting trends till later this weekend. In the meantime, attached is a gentle description of how the CSD plots are generated. A lot of good information there…but trend plots always make things more clear in my mind.
Thank ! No hurry ! Just take ur time !
I did not make a close up measurement hovering in differenrlt locations yet , to bussy
")
Thanks for the help so far and looking forward to the nexr part
Sorry but had to take these pics on camera while running out door
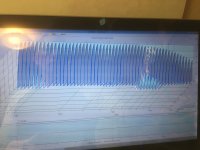
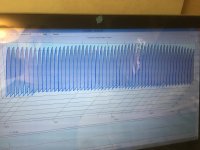
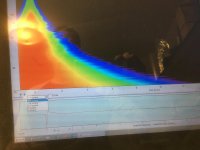
all pics are mic at about 1/4 inch
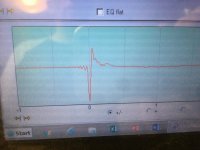
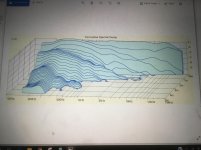
first two just to show reflection I believe from magnet structure around 5-8 khz?? ribbon 16mm wide,75 mm long, magnets 12mm deep. mic about 1/4 inch from ribbon but moved just slightly in pic 2
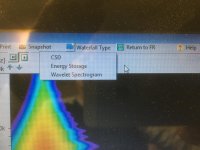
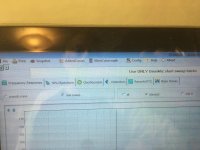
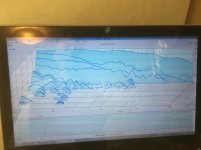
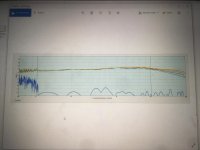
second two show some of the settings. The rest just some random stuff to maybe glean from. Not sure if this helps?
basically,except for freq response, once I move mic out into room away from ribbon the data looks absolutely awful no matter what settings I use. Just a sea of grass. Noisy environment??
also on the "energy storage" window, adjusting the time window seems to have no effect at all.
all pics are mic at about 1/4 inch
first two just to show reflection I believe from magnet structure around 5-8 khz?? ribbon 16mm wide,75 mm long, magnets 12mm deep. mic about 1/4 inch from ribbon but moved just slightly in pic 2
second two show some of the settings. The rest just some random stuff to maybe glean from. Not sure if this helps?
basically,except for freq response, once I move mic out into room away from ribbon the data looks absolutely awful no matter what settings I use. Just a sea of grass. Noisy environment??
also on the "energy storage" window, adjusting the time window seems to have no effect at all.
Attachments
Last edited:
Thanks! If I am seeing that right, there looks to be very few if any settings for the CSD plot. Attached is what I am putting together trends for the ARTA CSD. REW has similar set of controls.Sorry but had to take these pics on camera while running out door
Yes, once you move far enough away that reflections start to have similar magnitude to direct sound, the CSD plots will be quite noisy unless you can remove the reflections with settings, are isolate their effects with Burst or Spectrogram....once I move mic out into room away from ribbon the data looks absolutely awful no matter what settings I use. Just a sea of grass. Noisy environment??
Attachments
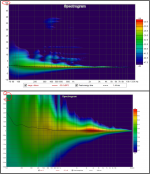
Huh...I hadn't noticed that before. Looks like the newer Beta versions of REW may have a small bug in the coding, splitting up the "m" from the "S" in "mS". Previous versions had them all together at the top of the axis.by the way in the sptral what does the m mean in the time domain...
Attachments
A brief visual overview of how different settings affect CSD plots is provided below. As mentioned in Post #33, the uncertainty principle is at play in that you cannot calculate and display high resolution in time and frequency simultaneously. As soon as you move away from a strict time domain display(impulse response) or frequency domain display(frequency response) you lose resolution in both domains. As Bill Waslo noted(Post#42), “…CSDs often show the user’s technique more than the speaker’s quality…”. In other words, it is difficult to compare measurements with CSD plots if they were generated using different settings or with different reflection-free windows.
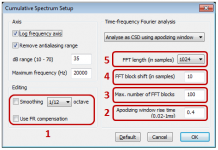
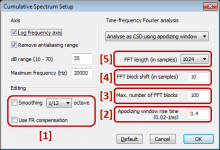
Attachment #1: ARTA provides a range of settings to manipulate the CSD to best effect. Just a short note about the editing settings [1]. CSD analysis is performed directly on the impulse response, not the frequency response. Most measurement systems, including ARTA, do not apply mic calibration data or smoothing to the impulse response. Rather, it is applied after the frequency response has been calculated from the impulse response. So, depending on what software you are using, your CSD plot may not begin with the expected frequency response at T=0. ARTA gives you the option to include/exclude mic calibration and smoothing to the results of the CSD calculations.
Attachment #2: The Rise Time [2] defines the slope of the window start and stop transitions. The FFT length [5] defines the length of the window in samples. The block shift [4] defines how far the window is moved along the impulse for each curve on the CSD plot. The number of shifts [3] along with the size of the shift [4] will define the span of the time axis on the CSD plot.
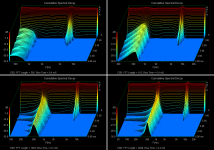
Attachment #3: With FFT Length of 2048, here is a trend of rise times. As rise time increases, the frequency resolution increases(narrowing of the peaks). But you lose more and more resolution in time, and completely lose sight of anything happening in the early part of the decay. In fact, with higher rise time settings the initial decay is pretty much defined by the window shape rather than the impulse response of the signal you are measuring. A setting in the 0.2mS – 0.4mS is a pretty good compromise.
Attachment #4: For a given rise time, the CSD plot can also be affected by the chosen window start time. In ARTA this is selected with a cursor in the impulse response viewing window. In other software, it may be chosen automatically based on what the software determines is the location of the start of the impulse. Sometimes this automatic selection can produce unexpected results. This plot set shows what to expect if the window is started earlier or later than optimum. Personally, I like to have control over it, and start it just a bit early so I can see a small flat shelf(impulse completely immersed in window) prior to the decay.
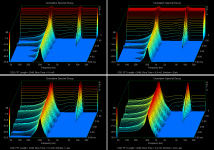
Attachment #5: For a given rise time, the frequency resolution of the CSD plot is also affected by the length of the window [5]. Increased window length gives improved frequency resolution. Looking at this trend, one may wonder why you wouldn’t always just set it to maximum? The answer is reflections.
Attachment #6: ARTA allows you to set a second marker just prior to a reflection. Then, as the window moves along, it begins to shorten in length once the end of the window reaches the second marker. The remainder of the FFT samples after the marker are then filled in with zeroes before performing the calculations.
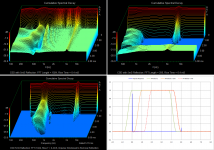
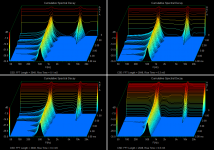
Attachment #7: With an impulse response that includes reflections, you wind up with a CSD plot with a lot of “grass” as lowmass mentioned, or a shelf of what often looks like “boiling water”. If you shorten the window length(upper right plot) you can often see the decay before the arrival of the reflection. A better solution is to set the window size as large as possible without encompassing the reflection, and then set a marker to exclude the reflection. When this is done, you will see the left hand side of the plot contains a curve of increasing LF limit as the window shrinks in size while it moves toward the reflection in the impulse curve. Still fairly useable though, unless…
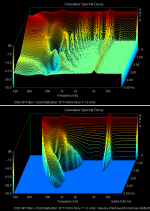
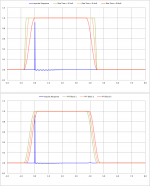
Attachment #8: As shown in Post #33 Attachment #3 and #4, if your measurement has a LF roll off within a couple octaves of resonance frequencies you are interested in, the left side of the CSD plot may be contaminated. Here is the same signal shown in Attachment #7 (500Hz and 5kHz resonances with a reflection at 5mS), but now with a LF roll off at 100 hz. Even with a window applied to remove the reflection, it is difficult to tell exactly what if anything is happening at 500Hz. So, if you are interested in decay behavior of a transducer, it is best to measure near field and with as much distance from reflecting surfaces as possible.
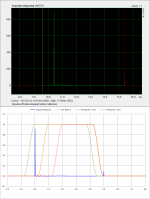
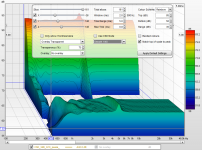
Attachment #9: REW has similar settings for the CSD plot, but I don’t find them as easy to use…probably just depends on what you get used to. For example, you can’t set markers to define the window start or remove reflections while viewing the impulse response. I prefer to directly see what I am setting where. I’ll add a few pointers on using the REW settings, and how they relate to the ARTA settings later this week.
Attachment #1: ARTA provides a range of settings to manipulate the CSD to best effect. Just a short note about the editing settings [1]. CSD analysis is performed directly on the impulse response, not the frequency response. Most measurement systems, including ARTA, do not apply mic calibration data or smoothing to the impulse response. Rather, it is applied after the frequency response has been calculated from the impulse response. So, depending on what software you are using, your CSD plot may not begin with the expected frequency response at T=0. ARTA gives you the option to include/exclude mic calibration and smoothing to the results of the CSD calculations.
Attachment #2: The Rise Time [2] defines the slope of the window start and stop transitions. The FFT length [5] defines the length of the window in samples. The block shift [4] defines how far the window is moved along the impulse for each curve on the CSD plot. The number of shifts [3] along with the size of the shift [4] will define the span of the time axis on the CSD plot.
Attachment #3: With FFT Length of 2048, here is a trend of rise times. As rise time increases, the frequency resolution increases(narrowing of the peaks). But you lose more and more resolution in time, and completely lose sight of anything happening in the early part of the decay. In fact, with higher rise time settings the initial decay is pretty much defined by the window shape rather than the impulse response of the signal you are measuring. A setting in the 0.2mS – 0.4mS is a pretty good compromise.
Attachment #4: For a given rise time, the CSD plot can also be affected by the chosen window start time. In ARTA this is selected with a cursor in the impulse response viewing window. In other software, it may be chosen automatically based on what the software determines is the location of the start of the impulse. Sometimes this automatic selection can produce unexpected results. This plot set shows what to expect if the window is started earlier or later than optimum. Personally, I like to have control over it, and start it just a bit early so I can see a small flat shelf(impulse completely immersed in window) prior to the decay.
Attachment #5: For a given rise time, the frequency resolution of the CSD plot is also affected by the length of the window [5]. Increased window length gives improved frequency resolution. Looking at this trend, one may wonder why you wouldn’t always just set it to maximum? The answer is reflections.
Attachment #6: ARTA allows you to set a second marker just prior to a reflection. Then, as the window moves along, it begins to shorten in length once the end of the window reaches the second marker. The remainder of the FFT samples after the marker are then filled in with zeroes before performing the calculations.
Attachment #7: With an impulse response that includes reflections, you wind up with a CSD plot with a lot of “grass” as lowmass mentioned, or a shelf of what often looks like “boiling water”. If you shorten the window length(upper right plot) you can often see the decay before the arrival of the reflection. A better solution is to set the window size as large as possible without encompassing the reflection, and then set a marker to exclude the reflection. When this is done, you will see the left hand side of the plot contains a curve of increasing LF limit as the window shrinks in size while it moves toward the reflection in the impulse curve. Still fairly useable though, unless…
Attachment #8: As shown in Post #33 Attachment #3 and #4, if your measurement has a LF roll off within a couple octaves of resonance frequencies you are interested in, the left side of the CSD plot may be contaminated. Here is the same signal shown in Attachment #7 (500Hz and 5kHz resonances with a reflection at 5mS), but now with a LF roll off at 100 hz. Even with a window applied to remove the reflection, it is difficult to tell exactly what if anything is happening at 500Hz. So, if you are interested in decay behavior of a transducer, it is best to measure near field and with as much distance from reflecting surfaces as possible.
Attachment #9: REW has similar settings for the CSD plot, but I don’t find them as easy to use…probably just depends on what you get used to. For example, you can’t set markers to define the window start or remove reflections while viewing the impulse response. I prefer to directly see what I am setting where. I’ll add a few pointers on using the REW settings, and how they relate to the ARTA settings later this week.
Attachments
-
 CSD_08_Window_Reflection_w_HP.png122.4 KB · Views: 88
 -
 CSD_07_Window_Reflection_Trends.png186.8 KB · Views: 90
 -
 CSD_06_Window_Length_End.png93.2 KB · Views: 72
 -
 CSD_05_Window_Length_Trends.png154 KB · Views: 76
 -
 CSD_04_Window_Start_Trends.png188.5 KB · Views: 77
 -
 CSD_03_Window_Rise_Trends.png158.7 KB · Views: 164
 -
 CSD_02_Window_Rise_Shift.png58.3 KB · Views: 174
 -
 CSD_01_ARTA_Settings.png19.1 KB · Views: 167
 -
 CSD_09_REW_Settings.png226.5 KB · Views: 91
Last edited:
Yes thanks Bolserst!!
yea the omni mic really has few settings in CSD
What I have done over the years in developing my ribbon is simply stick to the very close mic method AND always comparing ( at the same time) to a known reference or two or three ha. I get repeatable results that make sens this way.
Although I cannot be absolutely sure of all things, this method has resulted in consistent measured results that the ear agrees with.
Hope you guys find the trends useful. I've been meaning to put a set together for my personal reference, so this was a good incentive to finally do it. After playing around with REW a bit more last night, I think it actually does include almost as much setting functionality as ARTA, just may be a bit trickier to understand exactly what you have. The important thing is to document the settings used so you can make apples-to-apples comparisons with future measurements. Should have a short write-up on the REW settings soon.
@ lowmass,
I guess if the auto settings of Omni Mic are consistently chosen from measurement to measurement it may actually be more useful for the majority of users just wanting to perform comparisons with minimal effort.
@ lowmass,
I guess if the auto settings of Omni Mic are consistently chosen from measurement to measurement it may actually be more useful for the majority of users just wanting to perform comparisons with minimal effort.
Hope you guys find the trends useful. I've been meaning to put a set together for my personal reference, so this was a good incentive to finally do it. After playing around with REW a bit more last night, I think it actually does include almost as much setting functionality as ARTA, just may be a bit trickier to understand exactly what you have. The important thing is to document the settings used so you can make apples-to-apples comparisons with future measurements. Should have a short write-up on the REW settings soon.
@ lowmass,
I guess if the auto settings of Omni Mic are consistently chosen from measurement to measurement it may actually be more useful for the majority of users just wanting to perform comparisons with minimal effort.
OOOh wow that sounds even better ! a write up on rew
since that is what i tend to use. and yes i would love to use same settings everytime and see where im going Looking forward to the REW write up !
- Status
- This old topic is closed. If you want to reopen this topic, contact a moderator using the "Report Post" button.
- Home
- Loudspeakers
- Planars & Exotics
- some can help out in making a popper CSD waterfall ?