I agree, considering the voltages involved you are most likely operating down near u0. Also, the core material is likely of higher nickel content which has higher u0, generally less variation between u0 & umax, but saturates at lower flux density.…I measured quite a lot of MM Cart's over a very large spread of levels and never noticed but a minimal change in inductance. The explanation can only be that B/H was still around u0 all the time, that's the reason why I was a bit surprised by your graphs.
The HF peak at or above 20kHz is usually caused by the winding to core or winding to winding capacitance resonating with the leakage inductance. Adding something on the order 20pF-40pF between primary and secondary windings you should see the peak appear in the impedance plot. Note that this will make little difference in the response of ESL since it is loading before the leakage inductance. In reality the capacitance is distributed along the winding height, but lumping it in one spot can provide reasonable simplification for modeling.…So what can we learn from this, is it the Audio transformer that has a very large spread, or are different transformers used from time to time ?
And why do the all measurements have this impedance peak at 20Khz, except for the LTSpice model that doesn't have this peak ?
The Quad transformers have likely had a spread of core materials and variations in exact winding geometry over their production life which will account for many of the variations you see. The magnitude of the LF peak is a function of the core losses which not only varies with core material, but also with flux density(ie input voltage) for a given material. When driven from a reasonably low output impedance amplifier, the core loss term also has little effect on the response of the ESL. In some of my ESLs, I included a 30ohm /50Watt resistor shunted across the input to help minimize impedance variation and phase angle to make the load more amplifier “friendly”.
Some additional posts on this topic here:
Full Range Electrostatic Question
Full Range Electrostatic Question
Attachments
<snip>
Speaking of Sheldon. Perhaps he has a spare transformer he could measure. I would be glad to measure one of mine if everything else fails. It's just my workshop is filled with boxes while rebuilding the house. So it will take a little bit of work to get to the speakers. But, at least I can see where they are
<snip>
Let's see if Sheldon steps in. Else I will have to dig out a speaker.
Somebody call my name?

I've got spare everything, I'll mail you a pair of transformers if you'd like. LET me know what you'd like me to measure (types of measurements) and I'll be glad to do it.
I was bicycling around in Denmark for a couple weeks in 2018. What a lovely place, I'd move there if I got an opportunity.
Sheldon
I would be happy to measure the transformers and the inductors and we are in the same country. Still a lot of overhead to ship.
I may be opening the dead quad here and can make some measurements then, I just need to get some (lots of) stuff out of the way.
You are right about saving on shipping costs.
I have a vector network analyzer, that covers the range to 3Mhz.
That enables to find most hidden parameters.
When you have the same equipment at your disposal, it would be a good idea to do the measurements in the US.
Hans
Hans Polak, i have 9 pairs of those lovely ones and some spare parts...
What do you want me to measure?
Under what conditions?
Output and input impedance loading? Voltage levels? Frequency?
ESL63, that's a fantastic offer.
Do you live in Europe, in that case it would save quite some costs compared to shipping from the States to the Netherlands.
As mentioned in the previous posting, I would like to measure the Audio Transformer and the Delay Inductor with my VNA at various levels over the whole frequency band.
That will let me uncover all parameters that are needed for a as good as possible LTSpice model.
Hans
I have a Bode 100 analyzer I can use as well as other tools to cross check any results. The Agilent VNA I have starts at 10 KHz and goes to 3 GHz but is not really the right tool
Trapped at home has given me a good push on clearing out and putting away the dead projects etc. Hopefully I'll get to the Quad in a few days.
Trapped at home has given me a good push on clearing out and putting away the dead projects etc. Hopefully I'll get to the Quad in a few days.
I have a Bode 100 analyzer I can use as well as other tools to cross check any results. The Agilent VNA I have starts at 10 KHz and goes to 3 GHz but is not really the right tool
Trapped at home has given me a good push on clearing out and putting away the dead projects etc. Hopefully I'll get to the Quad in a few days.
Wow, you are well equiped.
The Bode has a perfect range starting at 1Hz into the Mhz range, excellent.
Hans
Steve,The HF peak at or above 20kHz is usually caused by the winding to core or winding to winding capacitance resonating with the leakage inductance. Adding something on the order 20pF-40pF between primary and secondary windings you should see the peak appear in the impedance plot. Note that this will make little difference in the response of ESL since it is loading before the leakage inductance. In reality the capacitance is distributed along the winding height, but lumping it in one spot can provide reasonable simplification for modeling.
You made my day.
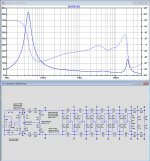
By inserting two 60pF caps between Pr-Sec, two things where achieved:
1) there's now the impedance peak slightly above 20Khz, but without causing any effect of the FR
2) The impedance is no longer steeply going up above 20Khz as it did before, but now stays nice flat way beyond 50Khz.
We're getting closer and closer to the real thing.
Hans
Attachments
Hi Hans
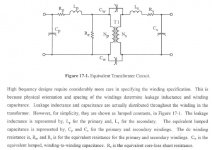
A good way of measuring the key transformer parameters is to short the primary winding and measure the secondary impedance vs frequency.
The measured response will look like a high-Q second-order low-pass filter response. From that, its quite easy to determine the leakage inductance, winding capacitance and the series resistance seen by the speaker panel.
We're getting closer and closer to the real thing.
Next you'll need to simulate the bad glue on the stators...
Sheldon
Next you'll need to simulate the bad glue on the stators...
Sheldon
Simulation model is just for fun, see it as an intellectual challenge.
Hans
P.s. I have a steel framed ESL63 Pro, so glue is hopefully less important
Last edited:
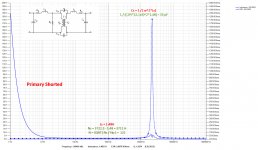
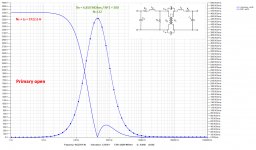
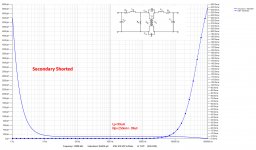
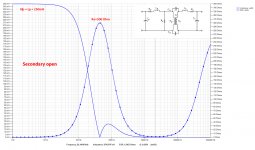
Because of being Corona restricted in my movements, I decided to make a set of virtual VNA measurements, using the ESL63 transformer as used in the current LTSpice model.
I made 4 graphs as follows:
1) measured from the primary with the secondary open, resp. 2) with the secondary shorted, 3) measured from the secondary with the primary open, resp. 4) with the primary shorted.
Rp=0R37 and Rs=3K56 are easily to measured at DC with a multimeter.
The other parameters are found from the measurement with the exception of Cw.
This cap however, that is responsible for the impedance peak at 21kHz, has no influence on the FR, so is no real problem.
The set of measurements are in this case assuming a stable permeability, which as we know is not at all the case.
So several of these measurements will have to be taken at various levels.
With this information I would like to try to implement the real B/H curve with the Chan model, making the model even more realistic.
Hans
.
Attachments
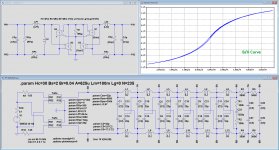
In preparation of the expected measurement results to be taken from the ESL63 audio transformer, I already developed a universal working model for this transformer that has all the parameters of the real one, like saturation, coercivity and remanence.
In the images below I just used a number of assumptions to be refined at a later stage, like length of the magnetic path of 2pi*3cm, no air gap, a cross section of 2.5cm^2 and common used value for Hc and Bs for the (silicon steel ?) core material.
With just 2 remaining variables, Br and the number of turns N on the primary, I steered to get a primary inductance of 250mH and a distortion of ca.1% at 10Hz with a 6 volt input voltage, just as in the Danish test that Mogens recently made available.
This all resulted in the Spice images below.
First image shows the complete LTSpice model with the transformers modules and the B/H curve for the current choices made.
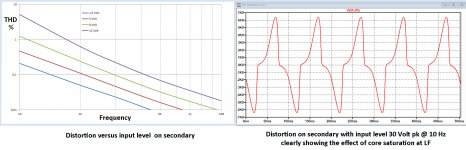
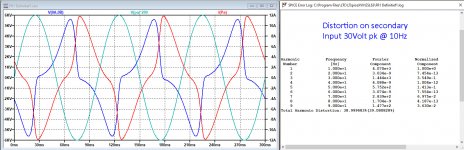
Second image shows the distortion measured on the secondary, loaded with the full ESL, as a function of input voltage and frequency, resulting in the same -20dB/dec reduction in distortion versus frequency as in the Danish test and also ca 1% at 10Hz@6volt. Distortion components are mainly agressive uneven harmonics.
This second image also shows the voltage on the secondary with 30 V pk @ 10Hz applied on the input.
Clearly visible are the saturation effects of the transformer. This is not a combination of level and frequency that the ESL63 should be exposed to, so the use of an anti-rumble filter at 20 Hz is not a bad idea.
Hans
In the images below I just used a number of assumptions to be refined at a later stage, like length of the magnetic path of 2pi*3cm, no air gap, a cross section of 2.5cm^2 and common used value for Hc and Bs for the (silicon steel ?) core material.
With just 2 remaining variables, Br and the number of turns N on the primary, I steered to get a primary inductance of 250mH and a distortion of ca.1% at 10Hz with a 6 volt input voltage, just as in the Danish test that Mogens recently made available.
This all resulted in the Spice images below.
First image shows the complete LTSpice model with the transformers modules and the B/H curve for the current choices made.
Second image shows the distortion measured on the secondary, loaded with the full ESL, as a function of input voltage and frequency, resulting in the same -20dB/dec reduction in distortion versus frequency as in the Danish test and also ca 1% at 10Hz@6volt. Distortion components are mainly agressive uneven harmonics.
This second image also shows the voltage on the secondary with 30 V pk @ 10Hz applied on the input.
Clearly visible are the saturation effects of the transformer. This is not a combination of level and frequency that the ESL63 should be exposed to, so the use of an anti-rumble filter at 20 Hz is not a bad idea.
Hans
Attachments
Hans-
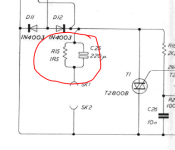
You should add the parts circled in red to fully model the input side. They can and often are bypassed and the cap is supposed to bypass the resistor at higher frequencies. I would model the caps as 100 to 500 milliOhms depending on frequency based on the one I just checked. That circuit is there to protect amps from the crowbar protection or so its claimed by some.
You should add the parts circled in red to fully model the input side. They can and often are bypassed and the cap is supposed to bypass the resistor at higher frequencies. I would model the caps as 100 to 500 milliOhms depending on frequency based on the one I just checked. That circuit is there to protect amps from the crowbar protection or so its claimed by some.
Attachments
Hans-
You should add the parts circled in red to fully model the input side. They can and often are bypassed and the cap is supposed to bypass the resistor at higher frequencies. I would model the caps as 100 to 500 milliOhms depending on frequency based on the one I just checked. That circuit is there to protect amps from the crowbar protection or so its claimed by some.
Hi Demian, thanks for your suggestion.
I also simulated with these components, but it hardly made any difference in the measured distortion.
I understood that this extra resistor+cap is there to lower DC current flowing through the transformers in case of a PA that has a DC offset, causing saturation.
As a sidenote, I have a set of ESL Pro speakers that do not have these two components.
Hans
Demian, here's the sim with the added 1R5//220uf that you advised.
As I said, there is hardly any difference with the previous sim without these two components.
Also notice in the distortion figures that it's all composed of benign uneven harmonics.
This time I have included the input voltage magnified in the image by 200 to compare it to the trafo output, and also the current supplied from the PA has been added to the image.
As can be seen, this asks for a current supply of 12 Amp pk.
A usual 100Watt @ 8 Ohm Amp being used for a Quad ESL, can hardly supply this kind of current, so distortion will be even worse as the ca. 40% as shown here.
But please keep in mind that in all this that it's just an outcome based on assumptions for the transformer that I made in preparation of .
So I'm eagerly waiting for more accurate info, like:
1) the average path length of the flux through the core,
2) the cross section of the core
3) does the core have an air gap
4) is the core indeed a sort of Silicon Steel
5) VNA measurements
That brings me to my next question concerning the envisaged measurements:
Is there already a possible sight on the if and when you have the time and the ability to answer a number of these questions and perform some measurements with your Bode100 ?
Hans
Attachments
Last edited:
- Home
- Loudspeakers
- Planars & Exotics
- QUAD 63 (and later) Delay Line Inductors