Jees Bolserst you outdone yourself ! when i read it is is like duh i would have used hornresp to model the simplest horn ever haha, may i ask what driver settings you used to model that ? since that can be very handy indeed ! to play with the slot. i only once looked at hornresp so i am not sure if i can only model the horn without driver parameters infuancing the outcome from the horn alone. ill re download it this weekend to see if i can get the same result.
Edged i used for the final baffle but never used it on panels alone....... so also a good point and would help to determine some peaks and dips. great !!
And the line source plot explains allot of the swing i encountered 'the wobble' so i should make it way larger to make that less of a thing since it is rather extreme to be honest. and the slot loading peak also is around 4 Khz so it doubles up on that spot with the wobble
About pushing the cavity out of the pass band, by the looks of it, the highest i get with the foil is around 16-17Khz.
Do you know if there are ways to combine those different plots into one ? and then overlay a rew measurement ? that would be the ultimate comparison and if you made that spreadsheet all combined would be the ultimate planar modeling software")
i am gone look at my measurements and see if im able to scale stuff maybe in photoshop to see if i can somehow overlay them and check some boxes in terms of stuff i should change.
About the drinking you are right haha i drunk allot of beer doing this haha. i thought i go mad every now and then. redoing some things for the 10th time
Thanks allot so far !!
Edged i used for the final baffle but never used it on panels alone....... so also a good point and would help to determine some peaks and dips. great !!
And the line source plot explains allot of the swing i encountered 'the wobble' so i should make it way larger to make that less of a thing since it is rather extreme to be honest. and the slot loading peak also is around 4 Khz so it doubles up on that spot with the wobble
About pushing the cavity out of the pass band, by the looks of it, the highest i get with the foil is around 16-17Khz.
Do you know if there are ways to combine those different plots into one ? and then overlay a rew measurement ? that would be the ultimate comparison and if you made that spreadsheet all combined would be the ultimate planar modeling software
i am gone look at my measurements and see if im able to scale stuff maybe in photoshop to see if i can somehow overlay them and check some boxes in terms of stuff i should change.
About the drinking
you are right haha i drunk allot of beer doing this haha. i thought i go mad every now and then. redoing some things for the 10th timeThanks allot so far !!
Last edited:
Sorry, I don’t remember the inputs I used for the Hornresp plot, as it was just an example I didn’t save it.
If all you want to see is what the slot would do, you just need to set the area and length of a straight (ie non-flared) horn section equal to the thickness of your baffle. For ESLs, the mass is so small, the air load from the slot can actually modify the motion of the diaphragm. Ribbons tend to have enough mass that this doesn’t happen. For best accuracy, you would need to calculate what you have as far as mass in grams/cm^2 and use that for determining the driver mass in hornresp based on the Sd area value you use. For ribbons I would use something on the order of 0.003 to 0.006 grams/cm^2.
Certainly it would be possible to combine everything you mentioned into one modeling program. I do that for myself with links to my various FORTRAN number crunching routines to get the bits I want to include. Unfortunately, I’m not currently in a position to devote the time necessary to make available a piece of software like that. Someday though…ESLs would be the priority, but ribbons could be easily incorporated.
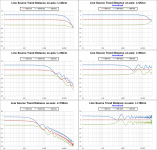
Yeah, finite line sources are frustrating to deal with…anything you change or any movement of the mic seems to have unexpected and often undesirable consequences. Generally you want to make the line very long, or very short to minimize this behavior. Below are a few trend plots I made to help you start understanding how the sound will change when you move your head(or mic) from the 1m-on axis point. We will call 20cm a short line, 180cm a long line, and 60cm the ugly middle sister. The simulated responses are for a constant acceleration driver.
Attachment #1: Here is a set of trend plots for doubling or halving distance from the ribbon.
The curves on the normalized plots are normalized relative to the response at 1m.
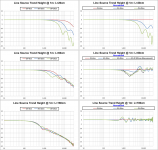
Attachment #2: Here is a set of trend plots for moving 10cm and 20cm above or below the center of the ribbon.
The curves on the normalized plots are normalized relative to the response at the center of the ribbon.
BTW, you don’t necessarily have to build a 180+ cm long line, you can stack several short ribbons to achieve nearly the same result. You may recall diyAudio member Few's thread on his effort with this method…highly recommending reading for anybody contemplating construction of a planar line source.
DIY planar magnetic + open baffle woofer array
For those interested in the math behind line source behavior, I would highly recommend the Vanderkooy paper on the subject: AES E-Library >> The Acoustic Radiation of Line Sources of Finite Length
There are plenty of trend plot data for those just interested in the results, and not necessarily how to calculate them yourself.
If all you want to see is what the slot would do, you just need to set the area and length of a straight (ie non-flared) horn section equal to the thickness of your baffle. For ESLs, the mass is so small, the air load from the slot can actually modify the motion of the diaphragm. Ribbons tend to have enough mass that this doesn’t happen. For best accuracy, you would need to calculate what you have as far as mass in grams/cm^2 and use that for determining the driver mass in hornresp based on the Sd area value you use. For ribbons I would use something on the order of 0.003 to 0.006 grams/cm^2.
Certainly it would be possible to combine everything you mentioned into one modeling program. I do that for myself with links to my various FORTRAN number crunching routines to get the bits I want to include. Unfortunately, I’m not currently in a position to devote the time necessary to make available a piece of software like that. Someday though…ESLs would be the priority, but ribbons could be easily incorporated.
Yeah, finite line sources are frustrating to deal with…anything you change or any movement of the mic seems to have unexpected and often undesirable consequences. Generally you want to make the line very long, or very short to minimize this behavior. Below are a few trend plots I made to help you start understanding how the sound will change when you move your head(or mic) from the 1m-on axis point. We will call 20cm a short line, 180cm a long line, and 60cm the ugly middle sister. The simulated responses are for a constant acceleration driver.
Attachment #1: Here is a set of trend plots for doubling or halving distance from the ribbon.
The curves on the normalized plots are normalized relative to the response at 1m.
- Notice that the short ribbon acts like a point source, increasing or decreasing level by 6dB for doubling or halving of distance.
- The long ribbon acts like a line source in the mids and highs, increasing or decreasing level by 3dB for doubling or halving distance. At lower frequencies it transitions to 6dB. More information on the frequency break point at which this transition occurs(and a spreadsheet calculator) can be found here: Segmented Wire Stator ESL simulator (esl_seg_ui)
Adding floor and ceiling reflections, and the line source behavior is extended to lower frequencies. See example here:
DIY planar magnetic + open baffle woofer array - The ugly (not short/not long) ribbon has large swings in midrange response as you move closer or further from it.
Attachment #2: Here is a set of trend plots for moving 10cm and 20cm above or below the center of the ribbon.
The curves on the normalized plots are normalized relative to the response at the center of the ribbon.
- The short ribbon acts like a point source, the highs rolling off as you would expect for a radiator of that size.
- The long ribbon acts like a line source in the mids and highs, showing essentially no change as you move up or down from the center...just some small ripples that get smaller the longer the line is.
- The ugly (not short/not long) ribbon again has large swings in midrange response as you already had measured back in post #32
BTW, you don’t necessarily have to build a 180+ cm long line, you can stack several short ribbons to achieve nearly the same result. You may recall diyAudio member Few's thread on his effort with this method…highly recommending reading for anybody contemplating construction of a planar line source.
DIY planar magnetic + open baffle woofer array
For those interested in the math behind line source behavior, I would highly recommend the Vanderkooy paper on the subject: AES E-Library >> The Acoustic Radiation of Line Sources of Finite Length
There are plenty of trend plot data for those just interested in the results, and not necessarily how to calculate them yourself.
Attachments
Sorry, I don’t remember the inputs I used for the Hornresp plot, as it was just an example I didn’t save it.
If all you want to see is what the slot would do, you just need to set the area and length of a straight (ie non-flared) horn section equal to the thickness of your baffle. For ESLs, the mass is so small, the air load from the slot can actually modify the motion of the diaphragm. Ribbons tend to have enough mass that this doesn’t happen. For best accuracy, you would need to calculate what you have as far as mass in grams/cm^2 and use that for determining the driver mass in hornresp based on the Sd area value you use. For ribbons I would use something on the order of 0.003 to 0.006 grams/cm^2.
Certainly it would be possible to combine everything you mentioned into one modeling program. I do that for myself with links to my various FORTRAN number crunching routines to get the bits I want to include. Unfortunately, I’m not currently in a position to devote the time necessary to make available a piece of software like that. Someday though…ESLs would be the priority, but ribbons could be easily incorporated.
Yeah, finite line sources are frustrating to deal with…anything you change or any movement of the mic seems to have unexpected and often undesirable consequences. Generally you want to make the line very long, or very short to minimize this behavior. Below are a few trend plots I made to help you start understanding how the sound will change when you move your head(or mic) from the 1m-on axis point. We will call 20cm a short line, 180cm a long line, and 60cm the ugly middle sister. The simulated responses are for a constant acceleration driver.
Attachment #1: Here is a set of trend plots for doubling or halving distance from the ribbon.
The curves on the normalized plots are normalized relative to the response at 1m.
- Notice that the short ribbon acts like a point source, increasing or decreasing level by 6dB for doubling or halving of distance.
- The long ribbon acts like a line source in the mids and highs, increasing or decreasing level by 3dB for doubling or halving distance. At lower frequencies it transitions to 6dB. More information on the frequency break point at which this transition occurs(and a spreadsheet calculator) can be found here: Segmented Wire Stator ESL simulator (esl_seg_ui)
Adding floor and ceiling reflections, and the line source behavior is extended to lower frequencies. See example here:
DIY planar magnetic + open baffle woofer array- The ugly (not short/not long) ribbon has large swings in midrange response as you move closer or further from it.
Attachment #2: Here is a set of trend plots for moving 10cm and 20cm above or below the center of the ribbon.
The curves on the normalized plots are normalized relative to the response at the center of the ribbon.
- The short ribbon acts like a point source, the highs rolling off as you would expect for a radiator of that size.
- The long ribbon acts like a line source in the mids and highs, showing essentially no change as you move up or down from the center...just some small ripples that get smaller the longer the line is.
- The ugly (not short/not long) ribbon again has large swings in midrange response as you already had measured back in post #32
BTW, you don’t necessarily have to build a 180+ cm long line, you can stack several short ribbons to achieve nearly the same result. You may recall diyAudio member Few's thread on his effort with this method…highly recommending reading for anybody contemplating construction of a planar line source.
DIY planar magnetic + open baffle woofer array
For those interested in the math behind line source behavior, I would highly recommend the Vanderkooy paper on the subject: AES E-Library >> The Acoustic Radiation of Line Sources of Finite Length
There are plenty of trend plot data for those just interested in the results, and not necessarily how to calculate them yourself.
THx again, the differences are rather big indeed for the 60 cm one. well i made fullranges as well, they got a much larger planar (130cm), and have less of these problems, i hoped i could made something in between
but the answer is no haha.Sorry, I don’t remember the inputs I used for the Hornresp plot, as it was just an example I didn’t save it.
If all you want to see is what the slot would do, you just need to set the area and length of a straight (ie non-flared) horn section equal to the thickness of your baffle. For ESLs, the mass is so small, the air load from the slot can actually modify the motion of the diaphragm. Ribbons tend to have enough mass that this doesn’t happen. For best accuracy, you would need to calculate what you have as far as mass in grams/cm^2 and use that for determining the driver mass in hornresp based on the Sd area value you use. For ribbons I would use something on the order of 0.003 to 0.006 grams/cm^2.
Certainly it would be possible to combine everything you mentioned into one modeling program. I do that for myself with links to my various FORTRAN number crunching routines to get the bits I want to include. Unfortunately, I’m not currently in a position to devote the time necessary to make available a piece of software like that. Someday though…ESLs would be the priority, but ribbons could be easily incorporated.
Yeah, finite line sources are frustrating to deal with…anything you change or any movement of the mic seems to have unexpected and often undesirable consequences. Generally you want to make the line very long, or very short to minimize this behavior. Below are a few trend plots I made to help you start understanding how the sound will change when you move your head(or mic) from the 1m-on axis point. We will call 20cm a short line, 180cm a long line, and 60cm the ugly middle sister. The simulated responses are for a constant acceleration driver.
Attachment #1: Here is a set of trend plots for doubling or halving distance from the ribbon.
The curves on the normalized plots are normalized relative to the response at 1m.
- Notice that the short ribbon acts like a point source, increasing or decreasing level by 6dB for doubling or halving of distance.
- The long ribbon acts like a line source in the mids and highs, increasing or decreasing level by 3dB for doubling or halving distance. At lower frequencies it transitions to 6dB. More information on the frequency break point at which this transition occurs(and a spreadsheet calculator) can be found here: Segmented Wire Stator ESL simulator (esl_seg_ui)
Adding floor and ceiling reflections, and the line source behavior is extended to lower frequencies. See example here:
DIY planar magnetic + open baffle woofer array- The ugly (not short/not long) ribbon has large swings in midrange response as you move closer or further from it.
Attachment #2: Here is a set of trend plots for moving 10cm and 20cm above or below the center of the ribbon.
The curves on the normalized plots are normalized relative to the response at the center of the ribbon.
- The short ribbon acts like a point source, the highs rolling off as you would expect for a radiator of that size.
- The long ribbon acts like a line source in the mids and highs, showing essentially no change as you move up or down from the center...just some small ripples that get smaller the longer the line is.
- The ugly (not short/not long) ribbon again has large swings in midrange response as you already had measured back in post #32
BTW, you don’t necessarily have to build a 180+ cm long line, you can stack several short ribbons to achieve nearly the same result. You may recall diyAudio member Few's thread on his effort with this method…highly recommending reading for anybody contemplating construction of a planar line source.
DIY planar magnetic + open baffle woofer array
For those interested in the math behind line source behavior, I would highly recommend the Vanderkooy paper on the subject: AES E-Library >> The Acoustic Radiation of Line Sources of Finite Length
There are plenty of trend plot data for those just interested in the results, and not necessarily how to calculate them yourself.
i've re read you posts. and i was aware of the drop 3 dB vs 6dB as well as the transision, but i never knew it would influance the midrange treble that much. when i think of it after i read your post it all makes sence ofcourse
To bad the half *** line source does not work that well
since i just made a small test with very small neos i still had. and i increased the open area from 17.6% to 25% Total open area, also the slots between magnets are 5.8 mm wide. and (not yet) even with spacing membrane to metal is now 4mm the magnets are 1 mm smaller then the previous so it could bring that back to 3mm as well. witch gives me 3 dB gain as well since a tweeter does not need 2 mm excursion The shear amount of extra gain is sick. i still do think for bass planars there is not a huge benefit of going neo (except insane efficiency) but midrange tweeters... pfeeeeeuuuw the thing is only 20 cm effective height now
so i can compare them to your models. so far (since it is late) i only measured really quick, and it reaches 20khz , there is a small hump at 12khz again but only 3 db or so. so nothing horrific like the early measurements. tomorow another day
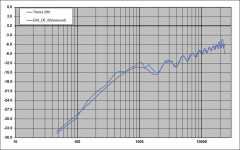
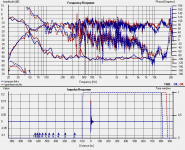
ill try to do some measurements acoording to your models, so we can put them beside eachother. the baffle did change slightly, but i can make a new EDGE thing of course Many years ago when I first started investigating line source ESLs, I was a little skeptical of the theoretical line source response with all those ripples and humps. I got an opportunity to measure a 64” ESL suspended well away from floor and ceiling in an auditorium, and must admit to feeling a sense of satisfaction seeing all those well-defined ripples appear. Attached is an example measurement 6ft from the panel overlayed with the theoretical response. Math works.…i never knew it would influance the midrange treble that much.
Attachments
Hi
We cant escape math.....
Here is a link of the response of audiostatic es100; a tall linesource:
Audiostatic ES-100 loudspeaker Measurements | Stereophile.com
You can see the same kind of ripples.
I think they are pretty harmless (non-resonant) ripples, at least, thats what I think to hear.
We cant escape math.....
Here is a link of the response of audiostatic es100; a tall linesource:
Audiostatic ES-100 loudspeaker Measurements | Stereophile.com
You can see the same kind of ripples.
I think they are pretty harmless (non-resonant) ripples, at least, thats what I think to hear.
Last edited:
Indeed!We cant escape math.....
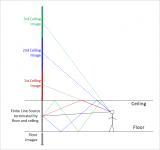
That has been my experience as long as the line is long enough to place the lowest, largest hump below the 1kHz - 4kHz range where our ears are most critical to small changes in tonal balance. The longer the line the smaller the ripples. If you can get the line nearly filling the floor to ceiling height, the mirror reflections from the floor and ceiling effectively lengthens the line, further reducing the ripples. In practice only the first mirror reflection can generally be counted on. The higher order reflections tend to be attenuated and scattered enough to not be very effective at lengthening the line except at the lowest frequencies.I think they are pretty harmless (non-resonant) ripples, at least, thats what I think to hear.
Simulated polar map showing the effect of floor/ceiling mirroring posted here:
DIY planar magnetic + open baffle woofer array
Attachments
As a consolation even a mathematically imperfect linesource will have better performance in the average listening room compared to a pointsource speaker....
yeah thats kind of the weird thing indeed, they do sound rather nice, and so think other people
but when measured. it is kind of a disappointment hahaIt is a combination of 4 things that define fr(resonance frequency) and Q :
1) Mass of the diaphragm + conductors (heavier makes fr lower)
2) Gap distance between diaphragm and magnets (larger gap makes fr lower)
3) Thickness of the channels or slots between the magnets including the outer plate. There is also an end correction similar to port end correction for vented enclosures. (thicker makes fr lower)
4) Percent open area. (Q increases as % open area decreases)
As you noted, the same behavior exists for ESLs, but usually it is more troublesome for planar ribbons because of the higher mass of the diaphragm and conductors, the added thickness of the magnets, and the lower % open area. The Monsoon drivers have higher diaphragm mass, but the %open area is much greater than the Neo8. A comparison was posted as Attachment #2 here:
Monsoon - Surprisingly Good!
A simple way to think about the cavity resonance is in terms of a Helmholtz resonator like a vented enclosure where the compliance or springiness of the air in the enclosure resonates with the mass of the slug of air in the port tube. In this case, you have the compliance of the air trapped between the diaphragm and the magnets resonating with the mass of the diaphragm and the mass of the air in the slots between the magnets.
I had posted some further descriptions in another ribbon thread here:
DIY ribbon dipole tweeter, reductio ad minimum #196
DIY ribbon dipole tweeter, reductio ad minimum #202
DIY ribbon dipole tweeter, reductio ad minimum #347
JonasKarud also posted a measurement where he had removed the front side of a Neo-8 planar:
DIY ribbon dipole tweeter, reductio ad minimum #185
The recently published AES paper mentioned in another thread discusses this behavior in more detail and shows how to use LTSpice to model the reflections between the different components of a planar ribbon or ESL and determine the response including the main resonance peak(aka cavity resonance) as well as the HF roll-off and additional peak and dips.
Superb article on HF ESL phenomena (IMHO)
Hol Bolserst. a bit later... but i once more play with it... yes
You named a few reasons that influence the fr and Q i wonder about what does the width between magnets do? i compared my push pull to a tymphani 1d tweeter and got some dimension measurements from pictures of the internet (there was one with a 0.5mm scale next to it so
) so there magnet is 2.8mm mine are 3 mm. if im correct this could lower fr about 1000 hz in my design. they use 2 wires with a small space in between. just like i do, but there space between magnets is 1.8mm compared to my 1.3 mm. still they have around 11.5% open area compared to my 17% due to metal choice.
here is a measurement i made allot of years back from my Tympani 1d push pull. its not the best measurement, but the cavity resonance is still visible. and it is allot higher up then what i get. any clue what that might be ?
there panels is around 60 cm long as well. and is mounted at ear height when seated.
Attachments
If the % open area is held constant but the width between magnets is increased, the effective thickness of the mass of air moving in the slot will change due to the end effect, similar to end correct factors used when calculating port lengths for vented enclosures.…You named a few reasons that influence the fr and Q i wonder about what does the width between magnets do?
I am not familiar with the Tympani 1D tweeter. Is it push-pull like yours? I would have to better understand the dimensions/spacings and weight of diaphragm and wires compared to yours before commenting on the HF differences you measured.…the cavity resonance is still visible. and it is allot higher up then what i get. any clue what that might be ?
- Status
- This old topic is closed. If you want to reopen this topic, contact a moderator using the "Report Post" button.
- Home
- Loudspeakers
- Planars & Exotics
- Vertical dispersion on planars. How much?