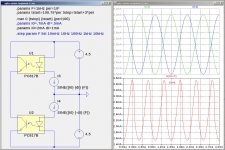
Some additional explanation of the plots in my previous post. The Ix(U1:C) plots show the series connected collector current versus the LED currents Ix(U1:A) and Ix(U2:A). The horizontal axis is the LED current Ix(U1:A), not simulation time, so that a family of curves can be plotted for the different frequencies and better portray the optocoupler transfer function. The "optocoupler time constants" I mentioned are primarily the photo-transistor capacitances that must be charged and discharged with very low base currents.
Here is what 3 cycles of the the 1kHz plot looks like vs. time.
Here is what 3 cycles of the the 1kHz plot looks like vs. time.
Attachments
Last edited:
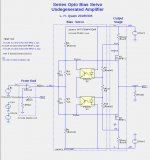
You cannot remove C1 and C2, because they are required to keep the voltage difference between the output FET gates nearly constant when a signal is applied. R2-R5 cannot be lowered too much without presenting an undesirable load on the FE output, having R2-R5 power dissipation issues, and shortening the RC time-constants of the R2-R4-C1 and R3-R5-C2 RC networks. The RC time constant needs to more than one second.so Lynn, is r6 (rcs) the reason that the sense resistors can be lower? It looks like the xa25 has .16 ohms for sense resistors. Can the r2 thru r5 be lowered way down and then remove c1 and c2?
In order to operate with 0R17 sense resistors, R6,R7, and R10 must be properly chosen. I will show some examples in future postings.
Hi Lynn
Great to see someone (i.e. you in this case) still exploring auto-biasing. I was beginning to think that folks had either lost interest or run out of ideas following the flurry of activity earlier in this thread.
I’m curious why you chose to connect the optocouplers in series though. Maybe this will become clear with your proposed future posts. Some months back I was exploring something similar but using parallel connected optocouplers which I chose in order to separate the signal component from the bias component. Perhaps your approach does the same but in a different way? I will need to study it some more.
One concern I had at the time was whether optocouplers can be easily matched (CTR) or whether packages with multiple devices would be good enough. Mismatches here can give rise to unwanted signal components appearing, i.e. positive and negative not cancelling completely. I suppose that a suitable choice of capacitor may alleviate this particular problem albeit depending on signal frequency.
Anyway, please keep up the good work. I'll be looking out for the next installment!
If the optos are in the same package, matching should not be an issue. But, I do not have empirical evidence of this for optocouplers.if you connect them in series (whichever way - inputs or outputs) , no need for matching
if you connect them in series (whichever way - inputs or outputs) , no need for matching
Can you elaborate? My simple thinking is that if the inputs are connected in series then each opto will produce a different output current if they are mismatched.
No, you are not being dumb. There are sound reasons to prefer the parallel opto output configuration. I am working on more postings about both series and parallel connected opto outputs. The process has been slow, because I am discovering more things as I put these findings together.I see that Lyn is connecting the opto's in series but I don't yet understand why. That is the reason I mentioned parallel connection and hence the need for matching. Perhaps I am just being dumb.
Empirical evidence? I noticed that Mouser sells single Lite-On optocouplers in all of the CTR grades, not does not list any CTR graded optocouplers ICs with more than one channel per package. Perhaps opto CTR matching is required for best performance with the parallel connected outputs.If the optos are in the same package, matching should not be an issue. But, I do not have empirical evidence of this for optocouplers.
it really depends how you chose to make circuit ...... in some cases there is summation of OPTO's output ...... and in some cases (probably ) isn't
I believe we prefer first ?
pucks gates anyway need to float ...... and what counts is voltage between them
as I said ....... I'm hardly looking at world in math therms , so I'm certain that I'm not seeing all permutations possible
")
I believe we prefer first ?
pucks gates anyway need to float ...... and what counts is voltage between them
as I said ....... I'm hardly looking at world in math therms , so I'm certain that I'm not seeing all permutations possible
Last edited:
series optocoupler bias circuits part 2
In part 1, I showed that the frequency response of the series connected optos might be troublesome. Here are simulation results that show the behavior immediately after the input signal is applied, and after 2 seconds have elapsed.
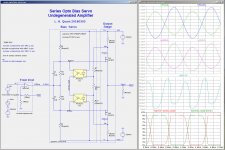
Below is the same circuit as in post #1240, and 2 cycles of a 1kHz signal into a 4R load at 1W, 5W and 25W. The waveforms, from top to bottom are the LED currents, the current throught the series connection opto transistors, and the FET drain currents, all plotted vs. time. You can see that in the bottom plots all of the traces intersect at 1.0A. Good, so far.
In part 1, I showed that the frequency response of the series connected optos might be troublesome. Here are simulation results that show the behavior immediately after the input signal is applied, and after 2 seconds have elapsed.
Below is the same circuit as in post #1240, and 2 cycles of a 1kHz signal into a 4R load at 1W, 5W and 25W. The waveforms, from top to bottom are the LED currents, the current throught the series connection opto transistors, and the FET drain currents, all plotted vs. time. You can see that in the bottom plots all of the traces intersect at 1.0A. Good, so far.
Attachments
series optocoupler bias circuits part 2
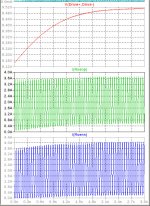
Here is 2 seconds of that circuit's responds to a 20Hz 25W single onto a 4R load. Note that RsenN is initially not conducting, but after about .5 sec begins to conduct. More informative is the V(Drive+,Drive-) plot that shows a significant increase in gate-gate bias. It is not obvious to me how this impacts to sound quality of this amplifier, other than it is not really class-A when the signal is first applied.
Here is 2 seconds of that circuit's responds to a 20Hz 25W single onto a 4R load. Note that RsenN is initially not conducting, but after about .5 sec begins to conduct. More informative is the V(Drive+,Drive-) plot that shows a significant increase in gate-gate bias. It is not obvious to me how this impacts to sound quality of this amplifier, other than it is not really class-A when the signal is first applied.
Attachments
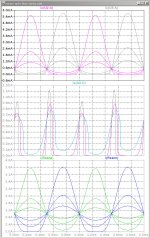
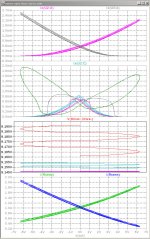
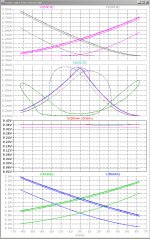
Here are other examples of the response of the series opto circuit. The first two sets of plots are the initial response (time starting as 0secs) to 1kHZ into 4R at 1W, 5W, and 25W. The second sets of plots are 5W into 4R at 20Hs, 100Hz, 1kHz, and 10kHz. The horizontal axis of these plots is V(out).
You should note that the V(SenP) and V(SenN) plot intersections are stable at 1.0A in the plots at 1W, 5W and 25W, but vary some in the plots at the different frequencies.
The next post will show what happens later. Stay tuned ...
You should note that the V(SenP) and V(SenN) plot intersections are stable at 1.0A in the plots at 1W, 5W and 25W, but vary some in the plots at the different frequencies.
The next post will show what happens later. Stay tuned ...
Attachments
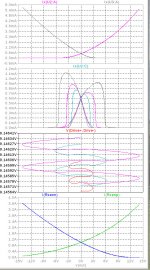
Here is what happens after 2 seconds under the same conditions. The FET bias changes significantly. Does this affect the sound quality? I do not know. But it certainly changes you bench measurements of the class-A operation region and to some extent your distortion measurements, because such measurements are normally performed with longer than 2 seconds duration sine waveforms.
Stay tuned for an alternative, parallel optocoupler circuit that does not have this behavior. ...
Stay tuned for an alternative, parallel optocoupler circuit that does not have this behavior. ...
Attachments

Very detailed analysis – nice!
Your results appear to show quantitatively what one might assume intuitively, i.e. since the series connection of the optocoupler outputs result in a current roughly equal to the minimum of the LED currents (as you said in an earlier post), any signal will tend to reduce the optocoupler output current and hence increase the bias. Given that C1 and C2 are large values, they will tend to sustain the reduced bias as your results show.
Parallel connection, as you are no doubt about to demonstrate, does not suffer this particular problem as the positive and negative parts of the signal tend to cancel and hence have less impact on the optocoupler output current and hence the bias. There are of course other issues to address though. One such issue has been mentioned before by Nelson and concerns the bias tending to zero when one of the output FETs saturates, i.e. as the output moves into class B due to a large amplitude signal. No doubt there are others.
As always, it is challenging to get auto-bias to work properly whilst keeping the associated circuitry simple. The latter becomes increasingly important if we wish to consider an amplifier with multiple pairs of output devices.
Looking forward to your next instalment Lyn.
Yes, I forgot to mention saturation of the opto output transistors. Here is the result from a 1W 1kHz signal into an 8R load. The horizontal axis is time, and the bottom plot shows the voltage across the opto output transistors. As you can see, during most of the time one or the other of the transistors has nearly zero volts across it, ie. is in saturation. This is an inherent property of the series connected optos, and explains the frequency dependent behavior of the output current Ix(U1:C). When the output transistors are switching between saturated and non-saturated state, each emitter-collector voltage changes by about 9V, charging or discharging the transistor internal capacitors.
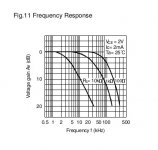
The second image is from the Lite-On LTV-8X7 series optocoupler datasheet showing the frequency response for different resistive loads on the output. Three parameters are far worse than depicted on this plot. Vce is 9V rather than 2V, Ic is about .5mA rather than 2mA, and the SERIES_NODE is totally floating, therefore the load resistance is much higher than shown in that datasheet plot. I am not sure how to properly estimate the frequency response from this datasheet, however it should give you some indication that it is will be quite low.
The second image is from the Lite-On LTV-8X7 series optocoupler datasheet showing the frequency response for different resistive loads on the output. Three parameters are far worse than depicted on this plot. Vce is 9V rather than 2V, Ic is about .5mA rather than 2mA, and the SERIES_NODE is totally floating, therefore the load resistance is much higher than shown in that datasheet plot. I am not sure how to properly estimate the frequency response from this datasheet, however it should give you some indication that it is will be quite low.
Attachments
Interesting observation, I hadn't even considered saturation of the optocoupler output transistors. Regarding the frequency response, isn't a low value a benefit in this application? Doesn't the bias value need to be held relatively constant whatever the signal?
Last edited:
- Home
- Amplifiers
- Pass Labs
- F4 Beast Builders