Hi jzagaja,
if you have inputs with same sensitivity you do not need calibration when measuring normal loudspeaker impedance. You will get error < 1%.
But, if you have different sensitivity or measure larger impedance you need calibration.
Do not be afraid of calibration, it gives us low measurement error.
Ivo
if you have inputs with same sensitivity you do not need calibration when measuring normal loudspeaker impedance. You will get error < 1%.
But, if you have different sensitivity or measure larger impedance you need calibration.
Do not be afraid of calibration, it gives us low measurement error.
Ivo
Works very well. Ref resistor 47R, 38R value in Limp to get proper reading. Is calibration necessary?
A pretty Manger MSW driver you have there! Make sure to remove it from the box to get proper impedance measurements. The driver needs to be suspended in free air to get the impedance curve right.
I'm sorry if this is a double post but I was unable to find the answer, despite many attempts. A reference to a manual or post where this is covered would be appreciated.
I've been working with Arta a few months now while building our test setup and slowly things are falling into place. There is just on thing that I can't get my head around: measuring actual SPL.
What I've done so far:
Setup Audio Device (RME Babyface Pro using ASIO Drivers)
Sound Card Calibration
For the Microphone sensitivity I used the manufacturers specs for now. We are using (amongst others) MK 221 and MK 301 by Microtech Gefell so I am assuming that their spec is at least within a few dB accurate.
"Use microphone on" is checked and set to 5mv/Pa for the MK301, 50 mv/Pa for the MK221.
Hardware is set to semi-dual channel with right output looped back to right input.
We use Impulse response with sweeped measurement, center peak of impulse response, -12 dB (which in our setup corresponds to 2,00V rms or 1 Watt @ 4 ohm).
In the frequency response graph, Sound Pressure Units are set to db re 20 uPa/V.
Besides the measured SPL that is off by ~5 - 10 dB, ARTA seems to compensate for increased levels. This means that if I repeat the measurements on -12db, -9dB, -6dB etc. the resulting SPL graph keeps showing the same level rather than shifting 3 dB between measurements. So before I focus on getting the microphone sensitivity right I need to know what ARTA is doing:
How is ARTA calculating the SPL value and why the don't the levels increase between measurements performed on different levels.
It seems now that the only two options we have for SPL reference is 20uPa/V or 20 uPa/2,83V? And I'd say that the "V" part is dependant on the Measurement Level, so it would be better if we could reference to the actual output level? Please forgive my ignorance if I'm way off here, I'm not exactly an acoustics engineer (but I'm learning") ).
).
I've been working with Arta a few months now while building our test setup and slowly things are falling into place. There is just on thing that I can't get my head around: measuring actual SPL.
What I've done so far:
Setup Audio Device (RME Babyface Pro using ASIO Drivers)
Sound Card Calibration
For the Microphone sensitivity I used the manufacturers specs for now. We are using (amongst others) MK 221 and MK 301 by Microtech Gefell so I am assuming that their spec is at least within a few dB accurate.
"Use microphone on" is checked and set to 5mv/Pa for the MK301, 50 mv/Pa for the MK221.
Hardware is set to semi-dual channel with right output looped back to right input.
We use Impulse response with sweeped measurement, center peak of impulse response, -12 dB (which in our setup corresponds to 2,00V rms or 1 Watt @ 4 ohm).
In the frequency response graph, Sound Pressure Units are set to db re 20 uPa/V.
Besides the measured SPL that is off by ~5 - 10 dB, ARTA seems to compensate for increased levels. This means that if I repeat the measurements on -12db, -9dB, -6dB etc. the resulting SPL graph keeps showing the same level rather than shifting 3 dB between measurements. So before I focus on getting the microphone sensitivity right I need to know what ARTA is doing:
How is ARTA calculating the SPL value and why the don't the levels increase between measurements performed on different levels.
It seems now that the only two options we have for SPL reference is 20uPa/V or 20 uPa/2,83V? And I'd say that the "V" part is dependant on the Measurement Level, so it would be better if we could reference to the actual output level? Please forgive my ignorance if I'm way off here, I'm not exactly an acoustics engineer (but I'm learning
).Level mode and ratio mode
Hi,
You should be aware of two modes of measurements: level mode and ratio mode.
We usually measure input excitation ( u1) and output response (u2) of some system.
In ARTA, as in other Fourier analysers, we have two mode of response presentation:
1) Level mode – shows u2 (in dBV or dB re 20uPa) (in spectrum analysis and octave band analysis)
2) Transfer function (or ratio) mode – shows u2/u1 (dB V/V or dB re 20uPa /V) (in Imp and Fr modes).
(In Steps you can choose which mode to use in Measurement setup).
Normaly , the Level mode results depend on excitation (u1) while the transfer function mode gives result independent of input excitation level.
Transfer function always express results as if 1V of excitation is used (or you can choose 2.83V as reference).
Best,
Ivo
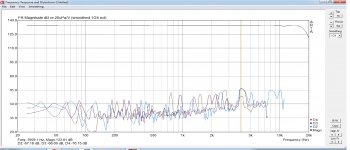
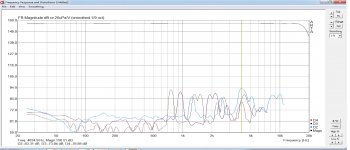
Hi, Ivo! How to take into account the internal distortion of the sound card when measuring an amplifier with distortions below the distortion of the sound card?
1. The "distortion" of the amplifier.
2. Sound card distortion, loopback mode.
1. The "distortion" of the amplifier.
2. Sound card distortion, loopback mode.
Attachments
What soundcard are you using?
Evidently some AD/DA chips don't use the same clock signal for input and output resulting in drift.
Measurement technology Post#131
Measurement technology Post#138
Evidently some AD/DA chips don't use the same clock signal for input and output resulting in drift.
Measurement technology Post#131
Measurement technology Post#138
Unstable repeated measurement results
Well,
it is quite normal that you have small changes in measured phase. It is quite common that best Fourier analyzers measure phase with +- 0.5 degree error.
It comes from noise, clock stability, temperature changes, etc. of measurement device.
The acoustical environment also add error due to noise and time variant behavior of wave propagation.
Finally the measurement loudspeaker changes characteristics in time (mostly the compliance).
All that contribute to total error.
The averaging helps us to get statistically best estimation.
Ivo
I keep constanly getting slightly different phase responses between repeated measurements, the changes are quite small but still large enough to screw up my loudspeaker crossover work, is there any known issues regarding this?
Well,
it is quite normal that you have small changes in measured phase. It is quite common that best Fourier analyzers measure phase with +- 0.5 degree error.
It comes from noise, clock stability, temperature changes, etc. of measurement device.
The acoustical environment also add error due to noise and time variant behavior of wave propagation.
Finally the measurement loudspeaker changes characteristics in time (mostly the compliance).
All that contribute to total error.
The averaging helps us to get statistically best estimation.
Ivo
Low signal to noise ratio of the reference input at low frequencies in a 2 channel config is one possibility.Yes, i am using dual channel but still getting this error, it is like i am moving the mic just slightly back and forth between each repeated measurement, which i am not doing
Try to aim to have the signal being measured (microphone) and reference input (amplifier output ?) as near as possible to equal in level as perceived by the sound card and shown in the bar graphs in ARTA in the capture window.
In my case I measure with a Behringer UMC204HD and I am able to put the left input in mic level mode and the right (reference) input in line level mode and separately adjust their attenuators to get the levels approximately balanced between mic and reference.
If your reference signal is more than about 30dB below the mic level or is not far enough above the noise floor you will have problems. Also your reference input should be DC coupled or at least be flat down to very low frequencies as attenuating the low frequencies can cause issues with the SNR at low frequencies. (See my previous posts about this earlier in this thread)
It does help, I often do it with MATAA before FFT of the impulse response. The relevant frequeny components are so low that the FFT has no way of discerning it from DC. Removing any DC or linear trend takes away most of the problematic low-frequency content that is not resolved in the impulse response.
Hi mbrennwa, others. Spent a better half of a day doing measurements with ARTA and noticed too late there was arbitrary DC offset / low frequency noise ruining most of the measurements... Being novice, didn't notice it before trying to simulate crossover. Live and learn. I found some of you were discussing about the same issue back in January 2019.
I don't know when I have another day off to take new set of measurements so it would be worth trying to salvage some of these.
Any tips if there was a way to clean some of the low frequency anomalies out? Checked out MATAA but it pretty much requires some custom code bulk process files from ARTA? I would be pleased if there was a tool to batch process these since full 360 hor + ver measurement sets for a huge three way speaker was commenced
I tried to find out what was causing the problem afterwards, but didn't find it out yet. Might be bad connector in my old sound card. It didn't occur on single channel measurements, only on two channel. Tried swapping between left and right, same problemo.
Thanks!
Attachments
Last edited:
Any tips if there was a way to clean some of the low frequency anomalies out? Checked out MATAA but it pretty much requires some custom code bulk process files from ARTA? I would be pleased if there was a tool to batch process these since full 360 hor + ver measurement sets for a huge three way speaker was commenced
What format are the ARTA files (I have never really worked with ARTA files, so I don't know)? Maybe just send me a few examples and I might give it a crack.
Thanks mbrennwa! ARTA saves impulse responses as .pir, which seems to be some kind of binary format. Could export to ASCII text file or CSV.
Actually, I got a link to a test version of VituixCAD that has DC offset option in the Convert IR to FR tool so my problem is kind of solved. At least the low frequencies between measurements are more uniform between each other and thus more usable in VituixCAD. Still cannot rely on the bottom end but at least can do some work with the measurements now. Better to confirm good data next time before proceeding too many hours
I could send you .pir files, or export some of them to CSV if you still want to check them out?
I could send you .pir files, or export some of them to CSV if you still want to check them out?
Sure! With a little help from the ARTA makers (Ivo?) I might be able to make an import tool for PIR files. Also, and ARTA export in ASCII format would be useful to have.
I don't see to get correct measurements with ARTA anymore.
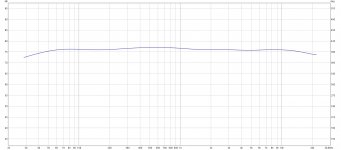
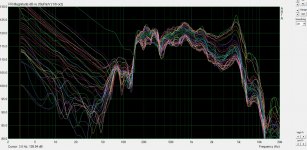
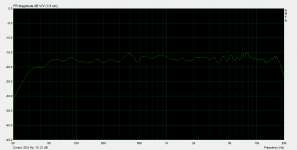
The 1/3 smoothing with ARTA doesn't look very smoothed and result is very different from REW as seen below. I'm using version 1.8.5. I am using the mic freqeancy response compensation. Edit: I had forgot to update to the latest ARTA version on this machine. Just did it, but with the same result as below.


The 1/3 smoothing with ARTA doesn't look very smoothed and result is very different from REW as seen below. I'm using version 1.8.5. I am using the mic freqeancy response compensation. Edit: I had forgot to update to the latest ARTA version on this machine. Just did it, but with the same result as below.
Attachments
Last edited:
Hi Omholt,
I don't understand your first statement.
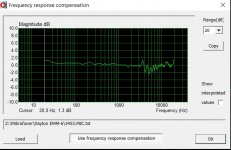
For me, the 1/3 octave smoothed ARTA measurements look very plausible. Your somewhat jumbled compensation file for the microphone can be found clearly in your measurement.
The REW measurement looks more like octave smoothed.
Regards
Heinrich
I don't understand your first statement.
For me, the 1/3 octave smoothed ARTA measurements look very plausible. Your somewhat jumbled compensation file for the microphone can be found clearly in your measurement.
The REW measurement looks more like octave smoothed.
Regards
Heinrich
Thanks for the reply.Hi Omholt,
I don't understand your first statement.
For me, the 1/3 octave smoothed ARTA measurements look very plausible. Your somewhat jumbled compensation file for the microphone can be found clearly in your measurement.
The REW measurement looks more like octave smoothed.
Regards
Heinrich
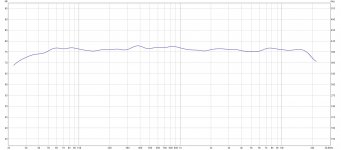
The REW measurement is with 1/3 oct. smoothing. Using 1/1 smoothing in REW would look like this:
I'm pretty certain the REW measurement is correct but I will double check with a third software I have.