ARTA DIY-Turntable
... here you will find some more information about the turntable:
https://www.youtube.com/watch?v=FWQudBXWUZs
Regards
Heinrich
... here you will find some more information about the turntable:
https://www.youtube.com/watch?v=FWQudBXWUZs
Regards
Heinrich
I have tried to contact him, but haven't received any reply. I'm interested in buying.Seems that the PCB+controller is for sale here for 99EUR
ARTA Turntable
and the other items are also reasonable price - so would make a nice DIY project.
Hi Bjorn,
I will inform Ralf about your attempt to contact him.
Here is some additional Information about the making of the DIY-Turntable:
https://vimeo.com/199557072
Regards
Heinrich
I will inform Ralf about your attempt to contact him.
Here is some additional Information about the making of the DIY-Turntable:
https://vimeo.com/199557072
Regards
Heinrich
My turntable version for ARTA is a 3D design to see when I can do it.
An externally hosted image should be here but it was not working when we last tested it.
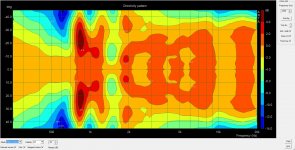
How can I change the db scale on the Y-axis to higher resolution for the polar plot? In this example, -6 dB ends up being out of bounds.
Hi,
the smallest range is 5dB which gives (color) resolution step of 0.5dB. You can adjust it with control "Range".
Allowing smaller range than this is not good as interpolation algorithm, and measurement itself, introduce some errors.
Best,
Ivo
If I minimize the range, I don't get to see out to -6dB. So that doesn't help me much.Hi,
the smallest range is 5dB which gives (color) resolution step of 0.5dB. You can adjust it with control "Range".
Allowing smaller range than this is not good as interpolation algorithm, and measurement itself, introduce some errors.
Best,
Ivo
Is there no way to change to angle on y-axis only?
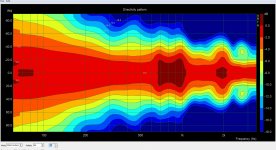
I would like to show it in similar way like this one where it's been used 80.
Attachments
If I minimize the range, I don't get to see out to -6dB. So that doesn't help me much.
Is there no way to change to angle on y-axis only?
I would like to show it in similar way like this one where it's been used 80.
Sorry,
I did not understood your question.
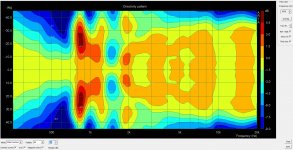
-6dB is meaningfull if you normalize responses.
Please make directivity plot again and normalize with response at zero angle.
Ivo
Is it possible to change the angle on the y-axis? For this spesific measurement it's automatically using 40 degrees. I want to change it to 80 degrees.Sorry,
I did not understood your question.
-6dB is meaningfull if you normalize responses.
Please make directivity plot again and normalize with response at zero angle.
Ivo
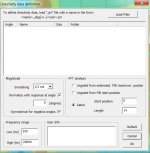
You can see the setup I've used below and the result. It's not showing me enough. -6dB is outside the graph. If I reduce it to 10 db range, it's only showing till -4 dB.
Attachments
It was tough to go through all the thread, so, sorry for asking, LIMP was working fine in XP but now I am unable to use it with Win 7 that too with Realtek hd audio, I know there is some driver problem but can any one of you guys have any idea for me ? Since now I can't hear anything from the spreadsheet while doing impedance measurements, which shows as zigzag pattern.
Thanks
Regards.
Thanks
Regards.
")
Hi Ivo,
I have the following question.
Suppose we want to make a frequency response measurement for a loudspeaker on a listening window of 10 degrees.
I measure the following 9 responses:
1. On axis,
2. 5deg Left Horizontal
3. 10deg Left Horizontal
4. 5deg Right Horizontal
5. 10deg Right Horizontal
6. 5deg Up Vertical
7. 10deg Up Vertical
8. 5deg Down Vertical
9. 10deg Down Vertical
and then make a "power average with overlays"
Will that be correct ?
In a listening room we have direct sound wave and reflections. The question is what will be the rms pressure at some point. The rms value is defined as integral of squared signal in time of one period. If we have many signals with different "random" phase (time flight) the total squared rms value will be equal to sum of individual squared rms values.
That is what statistical theory shows - and it is what we "expect" to measure.
Ivo
That is what statistical theory shows - and it is what we "expect" to measure.
Ivo
ok, I understand.
So what happens when each one of the above 9 measurements is gated, for example at 5 msec, and then we make a "power average" with all these 9 measurements.
Do you think that this is correct to do it?
The result that we will have is a better estimation of the direct sound of a loudspeaker ?
So what happens when each one of the above 9 measurements is gated, for example at 5 msec, and then we make a "power average" with all these 9 measurements.
Do you think that this is correct to do it?
The result that we will have is a better estimation of the direct sound of a loudspeaker ?