Ivo,
When I run ARTA on my Windows 7 (10 now) laptop in spectrum analyzer mode, I get the percentage distortion in the left hand side under the FFT. This is very handy, because it even works with an external generator.
Just the other day I bought an old laptop with XP in order to work with an E-MU 1616m cardbus. However, the percentage distortion is no longer displayed. Is there a software switch somewhere I fail to find, or is this feature not available under XP?
Regards,
Vac
Jitter Test
What should we see in the Jitter test? I know there is a sine at 1/4 sample frequency and that the LSB toggles at 1/192 sample rate. At 48K that means a 12K sine and 250Hz LSB toggle.
Below you see two different sound USB sound cards on the jitter test. One is an inexpensive home music type that sold for about $100. The other is a high end pro device used in the studios and on location. Cost about $900
Very different results. But what do we see? What should we see?
Attachments
Your second DAC appears to have a higher noise floor and is swamping the 250Hz spaced peaks.
I would switch your horizontal scaling to linear, center the graph on the 12khz peak, and then zoom so you can pick out more detail.
You should see the 12khz primary and the 250Hz peaks but nothing else if the DAC is functioning well/perfectly regards jitter.
Dave.
I would switch your horizontal scaling to linear, center the graph on the 12khz peak, and then zoom so you can pick out more detail.
You should see the 12khz primary and the 250Hz peaks but nothing else if the DAC is functioning well/perfectly regards jitter.
Dave.
Last edited:
I'd prefer displays with the same scales..... This is hard to compare.What should we see in the Jitter test? I know there is a sine at 1/4 sample frequency and that the LSB toggles at 1/192 sample rate. At 48K that means a 12K sine and 250Hz LSB toggle.
Below you see two different sound USB sound cards on the jitter test. One is an inexpensive home music type that sold for about $100. The other is a high end pro device used in the studios and on location. Cost about $900
Very different results. But what do we see? What should we see?
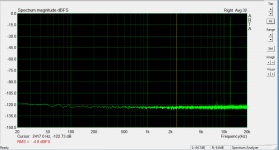
Here are 2 plots on the same scale. Hope that helps.
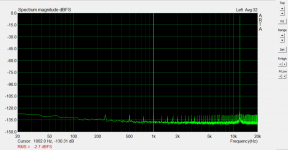
The plot that shows all the spikes spaced at 250Hz is a professional 24 bit card.
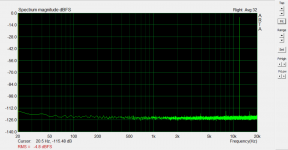
The other is a little M-Audio Fast Track 16 bit card.
Looking at the noise floor, it seems that the jitter spikes seen on the 24 bit card are all below the noise floor of the 16 bit card. Jitter spikes peak at -130dB while the 16 bit card's noise floor is around -120dB. Don't know if it's dropping the LSB or just that it's masked.
Also looked at linear frequency scale centered around 12K and didn't see anything different.
The plot that shows all the spikes spaced at 250Hz is a professional 24 bit card.
The other is a little M-Audio Fast Track 16 bit card.
Looking at the noise floor, it seems that the jitter spikes seen on the 24 bit card are all below the noise floor of the 16 bit card. Jitter spikes peak at -130dB while the 16 bit card's noise floor is around -120dB. Don't know if it's dropping the LSB or just that it's masked.
Also looked at linear frequency scale centered around 12K and didn't see anything different.
Attachments

Hi Pano,
the result for 24-bit card is really good - it shows clear spectrum of jitter stimulatring signal, but results for Fast track 16 bit card is also good, with slightly larger noise level on high frequency,
Lot of 16 bit card will show some response to jitter signal, but it is very often hard to distinguish it from spourious spectrum. That is the reason that I have not given possibility to expressing jitter level as single value in ns.
Ivo