Hi All,
I am a beginner to speaker design and wanted to study designing a DSP-based 3 way crossover in VituixCAD. I have selected the drivers for this project (since I have these drivers with me) as
1) Satori WO24P-8 for Woofer
2) SB15CAC30-8 for midrange
3) SB26CDC-C004 as the tweeter
Since this is more of an academic exercise for now to study the compatibility of drivers and to help me in building a cabinet with some confidence regarding driver locations on the baffle and the overall response, I have generated the crossover configuration based on traced SPLs of these drivers from their datasheets (I know that the recommended approach is to put the drivers in the cabinet and then take measurements and then design crossover based on it).
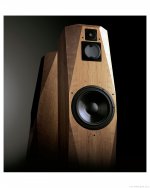
The simulations that I have attached along with this post have these drivers placed on a baffle of width 32cm and height 105 cm (with 20mm edge rounding for easing diffraction-related anomalies), currently, with driver centered at locations mentioned in the crossover image.
(For more details, the woofer is assumed to be put in sealed box of size 55L, midrange also in a sealed enclosure of about 12 L).
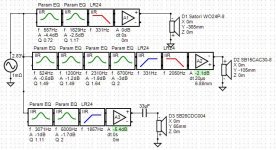
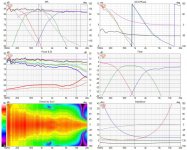
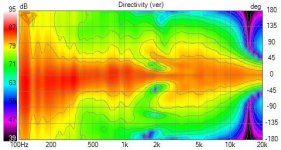
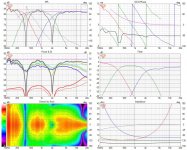
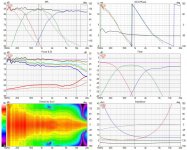
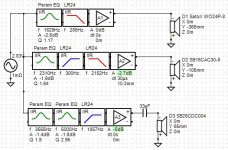
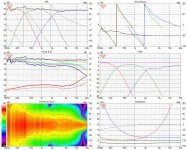
With my limited knowledge, I have tried to design a DSP-based crossover for this system as shown in the first attached image. The vituixCAD six pack showing resultant system response details is attached as the 2nd image. The 3rd image shows the veritical directivity polar plot for this crossover. The 4th image shows the same crossover with mid driver inverted. This was done just to see how good the overall phase tracking of drivers were in the crossover region.
The approach that I took in this iteration of the design was to try to linearize the response of the drivers in their passband as much as I could with parametric EQ and try to level match drivers based on woofer response. Then I crossed over all 3 drivers with 4th order Linkwitz-Riley (LR) filters at frequencies such that the phases of the crossed over drivers track each other till (approximately) an octave above and an octave below the crossover point. (From my limited knowledge I have also included a capacitor in the tweeter branch of the crossover for tweeter protection) Again, since this is not using measured phases of the drivers in the cabinet, I am assuming the phase responses that are shown are the minimum phase responses derived based on the magnitude responses, as calculated by VituixCAD.
I would like to know more details about how should I look at the driver phase matching, can I get better directivity curve and power response curve for this system (since I see a slight 'S' curve around 3.5 kHz in the directivity plot on the left hand side middle plot of 2nd image and slightly rising power response around the same point in the same plot can be adjusted.), etc and in general any advice to better the performance is welcome. I would also like to know if we reduce the baffle support for radiation from these kind of flat flanged tweeters by usinng deep Avalon acoustic like chamfers (shown in attached image 5), will it help in better directivity matching (at least to some extent) between tweeter and midrange driver. It will also supposedly push the baffle diffraction anomalies in tweeter response to much higher frequency ranges which may be smoothed by using felt pads on the baffle around tweeter etc, if required.
Looking forward to learn more from your valuable opinions.
I am a beginner to speaker design and wanted to study designing a DSP-based 3 way crossover in VituixCAD. I have selected the drivers for this project (since I have these drivers with me) as
1) Satori WO24P-8 for Woofer
2) SB15CAC30-8 for midrange
3) SB26CDC-C004 as the tweeter
Since this is more of an academic exercise for now to study the compatibility of drivers and to help me in building a cabinet with some confidence regarding driver locations on the baffle and the overall response, I have generated the crossover configuration based on traced SPLs of these drivers from their datasheets (I know that the recommended approach is to put the drivers in the cabinet and then take measurements and then design crossover based on it).
The simulations that I have attached along with this post have these drivers placed on a baffle of width 32cm and height 105 cm (with 20mm edge rounding for easing diffraction-related anomalies), currently, with driver centered at locations mentioned in the crossover image.
(For more details, the woofer is assumed to be put in sealed box of size 55L, midrange also in a sealed enclosure of about 12 L).
With my limited knowledge, I have tried to design a DSP-based crossover for this system as shown in the first attached image. The vituixCAD six pack showing resultant system response details is attached as the 2nd image. The 3rd image shows the veritical directivity polar plot for this crossover. The 4th image shows the same crossover with mid driver inverted. This was done just to see how good the overall phase tracking of drivers were in the crossover region.
The approach that I took in this iteration of the design was to try to linearize the response of the drivers in their passband as much as I could with parametric EQ and try to level match drivers based on woofer response. Then I crossed over all 3 drivers with 4th order Linkwitz-Riley (LR) filters at frequencies such that the phases of the crossed over drivers track each other till (approximately) an octave above and an octave below the crossover point. (From my limited knowledge I have also included a capacitor in the tweeter branch of the crossover for tweeter protection) Again, since this is not using measured phases of the drivers in the cabinet, I am assuming the phase responses that are shown are the minimum phase responses derived based on the magnitude responses, as calculated by VituixCAD.
I would like to know more details about how should I look at the driver phase matching, can I get better directivity curve and power response curve for this system (since I see a slight 'S' curve around 3.5 kHz in the directivity plot on the left hand side middle plot of 2nd image and slightly rising power response around the same point in the same plot can be adjusted.), etc and in general any advice to better the performance is welcome. I would also like to know if we reduce the baffle support for radiation from these kind of flat flanged tweeters by usinng deep Avalon acoustic like chamfers (shown in attached image 5), will it help in better directivity matching (at least to some extent) between tweeter and midrange driver. It will also supposedly push the baffle diffraction anomalies in tweeter response to much higher frequency ranges which may be smoothed by using felt pads on the baffle around tweeter etc, if required.
Looking forward to learn more from your valuable opinions.
Attachments
-
 3_way_active_project_v8 XO-schema-1.jpg65.1 KB · Views: 2,312
 -
 3_way_active_project_v8 Six-pack.jpg166.2 KB · Views: 2,078
 -
 3_way_active_project_v8 Directivity (ver).jpg27.9 KB · Views: 1,962
 -
 3_way_active_project_v8 Six-pack_mid_inverted.jpg172 KB · Views: 2,156
 -
 avalon speaker.jpg79.9 KB · Views: 2,650
I have tried to simplify the crossover and got the following 3 figures, which I have attached below
Figure-1: New crossover
Figure-2: System response for new crossover
Figure-3: System response for new crossover with mid reversed
Thanks
Vineeth
Figure-1: New crossover
Figure-2: System response for new crossover
Figure-3: System response for new crossover with mid reversed
Thanks
Vineeth
Attachments

All looks good to my uneducated eye, however, you do not have an Z offset for the drivers, with this all set to zero you mid will are effectively setting the mid about 20mm behind the baffle and the tweeter about 35mm behind the baffle because the acoustic centre is generally taken at the point where the dust cap meets the cone or the tip of the tweeter dome. Adding these into the driver data will need the delay figures altering. Note the Z axis in Vituix is +ve away from the listener I.e. into the baffle.
Last edited:
All looks good to my uneducated eye, however, you do not have an Z offset for the drivers, with this all set to zero you mid will are effectively setting the mid about 20mm behind the baffle and the tweeter about 35mm behind the baffle because the acoustic centre is generally taken at the point where the dust cap meets the cone or the tip of the tweeter dome. Adding these into the driver data will need the delay figures altering. Note the Z axis in Vituix is +ve away from the listener I.e. into the baffle.
Thank you for the response. I In this attempt, since the data for responses are traced I didnt pay serious attention to the delay part. I will make the cabinet, take measurements and then dial in appropriate delays for each driver.
Thanks a lot. These are traced on-axis curves from driver datasheets. As you pointed out, doing much adjustments with these curves would probably be a waste of time.
This directivity matching of drivers is where I wanted more guidance.
Could you elaborate a bit on any general strategies for achieving better directivity matching specifically in this 5 inch mid + 1 inch dome tweeter scenario. I have read that finding the right sized drivers for mid and tweeter helps a lot in directivity matching. Another option is using a waveguided tweeter and crossing over where directivity matches between the mid and tweeter. Are there any other strategies applicable in this scenario?
Would a deeply chamfered baffle like the Avalon speaker baffle help?
Would adjusting the crossover points for this topology/using other crossover topologies help?
Any other strategies?
Thanks
You have developed some good skills in EQ'ing responses and assigning filter frequencies and Q's.... this is good.
Because you are using the OEM supplied FR curves, these curves are 2-pi (infinite baffle) responses. Therefore what you have simulated so far is a flush mounted system, i.e. built into the front wall.
Next step in your learning process is to approximate a baffle shape and apply baffle step / diffraction responses to the OEM curves. This will change your filters quite a bit.
Good work so far !
j.
If you were planning to mount these speakers flush with the wall, your simulation would be close to
I'm beginning to find the wave guided tweeters to be almost mandatory, when it comes to smooth directivity and neutral sound - that's what I'm doing and that's what I would advice to do. Cool simulations... never knew how to do that. I simply tried a few things and learned from others work, then measured and dialed in an active system, within the limitations of the drivers I find to be up for the task.
I also linearize the drivers before applying filters.... seems to make better results.
I also linearize the drivers before applying filters.... seems to make better results.
You have developed some good skills in EQ'ing responses and assigning filter frequencies and Q's.... this is good.
Because you are using the OEM supplied FR curves, these curves are 2-pi (infinite baffle) responses. Therefore what you have simulated so far is a flush mounted system, i.e. built into the front wall.
Next step in your learning process is to approximate a baffle shape and apply baffle step / diffraction responses to the OEM curves. This will change your filters quite a bit.
Good work so far !
j.
If you were planning to mount these speakers flush with the wall, your simulation would be close to
Hi,
Thanks for your response. Actually these are traced ON-axis SPLs of drivers put on a baffle of width = 32 cm, and height = 105 cm (likely dimensions of a floorstanding speaker box baffle), with baffle diffraction effects applied. What I mean is I took each driver response, then put them at a location (with their center location as specified in the crossover plot) on the above sized baffle and used the diffraction tool in VituixCAD to apply baffle diffraction effects. Therefore baffle step/diffraction effects are already applied in the simulation results above.
I have also considered the effects of the woofer put in a sealed enclosure of 55 litres tuned into the 30's Hz and the midrange put into a sealed enclosure of about 12L. I did this using enclosure tool in VituixCAD. Therefore the low end response of both the woofer and midrange response should be having the rolloffs associated with the box volume mentioned above.
However, because the off axis responses are not actual measurements and only generated using vituixCAD, it might not be accurate when compared with a real measurement of each driver on this baffle.
Thanks
Last edited:
I'm beginning to find the wave guided tweeters to be almost mandatory, when it comes to smooth directivity and neutral sound - that's what I'm doing and that's what I would advice to do. Cool simulations... never knew how to do that. I simply tried a few things and learned from others work, then measured and dialed in an active system, within the limitations of the drivers I find to be up for the task.
I also linearize the drivers before applying filters.... seems to make better results.
Thank you for the suggestions.
I am considering applying a waveguide on this tweeter. But I don't know which one to use in this scenario. I have only seen FM augerpro's elliptical-type waveguide for this tweeter, which looks a little big if I am going to use an avalon-type chamfered baffle.
Regarding the driver passband linearization, I think the driver phase response (or the minimum phase part of it which is derived from the magnitude response via Hilbert transform operation?) is also shaped by the linearization EQ. Hence, it seems like a necessary step in the overall crossover design process. Therefore, I feel that this is what will help us achieve the phase tracking over larger frequency ranges. I think this is one of the reasons why we can see driver phases overlapping over each other over larger frequency ranges in my plots.
These are just my inferences from above simulations and maybe wrong. Please feel free to correct me if I am wrong.
Thanks
You should measure phase if possible, the transform only works properly if the response was originally minimum phase. Linearising the response is not a necessary step, as long as you get to the final response. Phase tracking..
You might do ok with these methods, they are shortcuts or are designed to suit when you don't have the proper equipment. I don't know where you want to draw the line, I just want you to have the facts.
You might do ok with these methods, they are shortcuts or are designed to suit when you don't have the proper equipment. I don't know where you want to draw the line, I just want you to have the facts.
Thanks. I agree that as you pointed out the minimum phase response need not be the actual response of the drivers in the cabinet.
I will definitely not design the final speaker crossover based on these traced SPLs. I have a minidsp Umik-1 and a dayton EMM-6 mic with an ESI U86XT audio interface. I am in the process of learning dual channel/semi dual channel measurement methods and in the process of getting a turntable like that recommended for ARTA measurements.
This whole exercise of crossover design was to get some confidence about what kind of cabinet to build, insights into good techniques that can be applied in crossover design, get expert opinions from FMs here on all possible aspects that can be considered / improved with restpect to this system and if possible once i have r real measurements, apply techniques learned to the system.")
I will definitely not design the final speaker crossover based on these traced SPLs. I have a minidsp Umik-1 and a dayton EMM-6 mic with an ESI U86XT audio interface. I am in the process of learning dual channel/semi dual channel measurement methods and in the process of getting a turntable like that recommended for ARTA measurements.
This whole exercise of crossover design was to get some confidence about what kind of cabinet to build, insights into good techniques that can be applied in crossover design, get expert opinions from FMs here on all possible aspects that can be considered / improved with restpect to this system and if possible once i have r real measurements, apply techniques learned to the system.
Actually these are traced ON-axis SPLs of drivers put on a baffle of width = 32 cm, and height = 105 cm (likely dimensions of a floorstanding speaker box baffle), with baffle diffraction effects applied.
Yes, you said that very clearly in your first post. I was not paying attention. Embarrassing.
I see now that your baffle step compensation is naturally incorporated into the gain of the woofer and mid, and the selection of crossover point. If you decide to go with a lower crossover from woofer to mid, you may need some BSC on the mid driver.
You are proceeding nicely. When you actually measure the drivers in the cabinet, you will probably find there are some meaningful differences in the off-axis responses compared to the diffraction simulation, particularly from 70 degrees to 180 degrees. It is nothing to be concerned about, but if you do see differences, do not be surprised.
j.
Thanks again.
I will definitely keep these in mind while measuring, though it is still some time away, as I will need help in building the cabinets. Could you please explain a bit more about why these particular off axis angles differ the most?
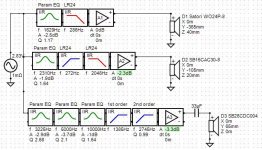
In the meanwhile, I tried a bit more with crossover. Please find the results attached.
I will definitely keep these in mind while measuring, though it is still some time away, as I will need help in building the cabinets. Could you please explain a bit more about why these particular off axis angles differ the most?
In the meanwhile, I tried a bit more with crossover. Please find the results attached.
Attachments
Could you please explain a bit more about why these particular off axis angles differ the most?
When you traced the OEM curves, you had access to the OEM-measured data at 0, 30, 45, 60 degrees most likely. VituixCad2 simulates the response out to 180 degrees. Beyond 70 degrees or so, the simulations of off-axis response have greater levels of uncertainty, and you have no OEM data to check it.
Your latest Sim is interesting. You have a non-symmetric 3rd order filter on the tweeter. This is an interesting technique which can allow a nice power response curve and a nice on-axis curve. In other words, the DI curve does not have a hump at 2k which often happens with LR2 and LR4 crossovers. Kimmo has mentioned this technique a few times, and I am just starting to explore it in my system.
j.
- Home
- Loudspeakers
- Multi-Way
- A 3 way design study