")
I'm no expert either, but this may help (and if I am wrong, I will benefit from the correction):
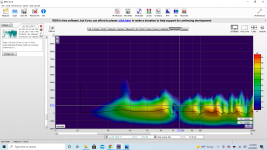
Spectrogram Graph
"The spectrogram is like a waterfall viewed from above, with the level indicated by colour."
As I understand it:
A flat-ish spectrogram is good: it means the system goes from sound-to-silence quickly.
Where you see a vertical streak on the spectrogram, there's some problem with the materials or geometry of the system which causes it to still be releasing sound energy after the input has gone.
This has 16 real world examples measured and discussed:
Audio Asylum Thread Printer
Another example at the bottom of this article:
Voice Coil Spotlight: The Beryllium Advantage | audioXpress
Time and freq axes are flipped, relative to the prior example, otherwise same same.
Voice Coil Spotlight: The Beryllium Advantage | audioXpress
Time and freq axes are flipped, relative to the prior example, otherwise same same.
Change the settings to be something more like this then you will get a better view, it is a good time frequency view that makes it easy to see what is happening with different frequencies at different times.
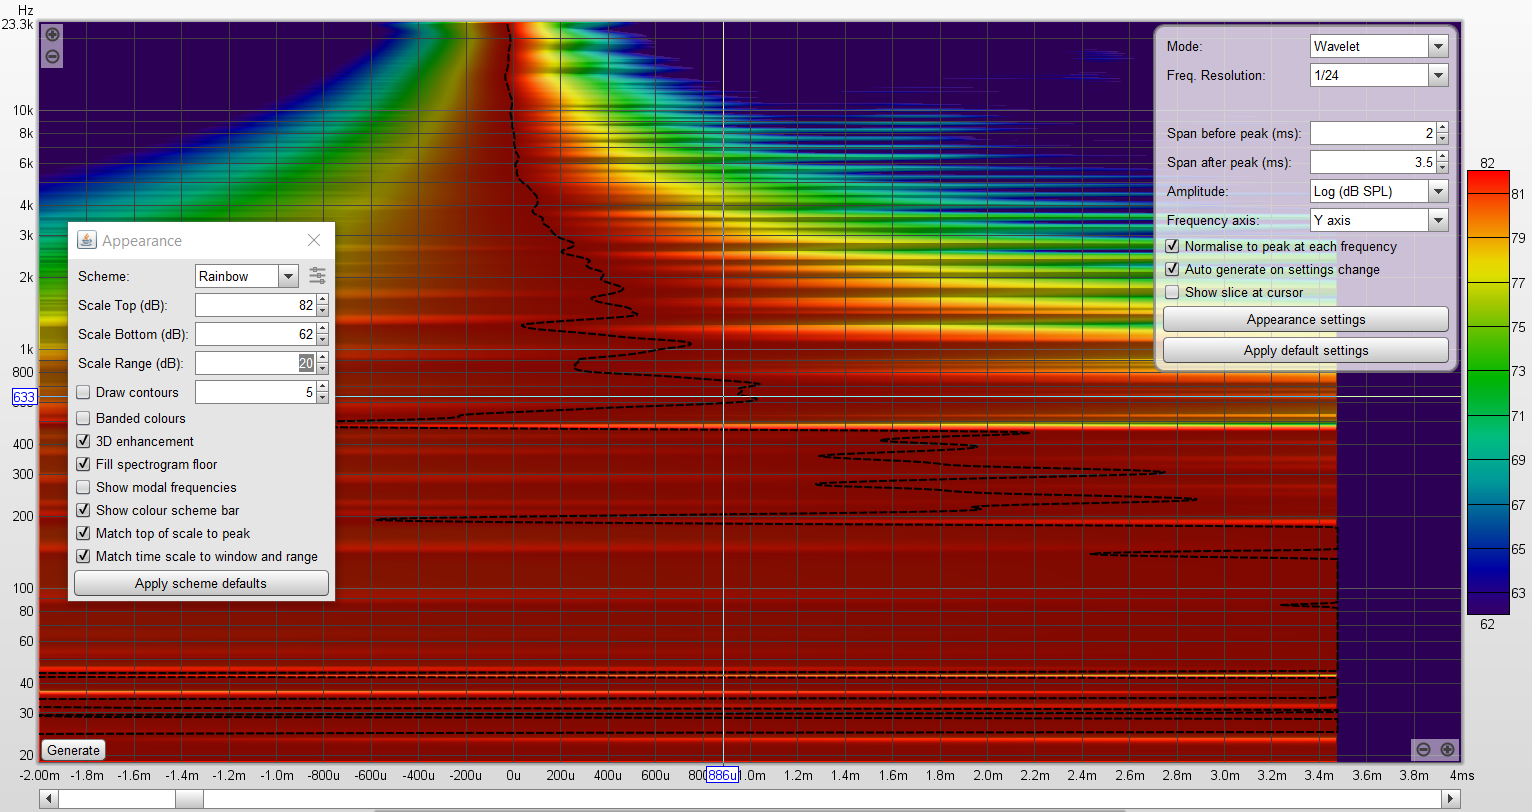
By changing the amount of time in the window and scale you will be able to change it to see more of the speaker or more of the room depending on what you are looking for.
By changing the amount of time in the window and scale you will be able to change it to see more of the speaker or more of the room depending on what you are looking for.
- Home
- Design & Build
- Software Tools
- REW help