Okay, I decided to try something more. I'm going to attempt, at least, to mop up the last of my top module side panel resonances. Thin copper plates with aluminum backed car panel deadener sheets applied(cld again, but a more conventional version) and then placed on the outside of the cabinet side walls. They will be low profile, hopefully look good, and match my cherry wood cabinets to a certain degree. I'll do before and after measurements of course. Should be an interesting experiment.
Last edited:
That's a good idea. My front baffle plate is a couple mm too wide on each side, so these side panel sheets, if they work, should meet up with the edge of the baffle perfectly. There are some loudspeaker companies that have interchangeable side plates for cosmetic purposes. This would be like that, but with a more functional purpose. Hopefully it will turn out like I'm imagining.
Last edited:
Ah, here it is. Sonus Faber Chameleon.
Home Theater Luxury Sound Systems Chameleon Collection | Sonus faber
Home Theater Luxury Sound Systems Chameleon Collection | Sonus faber
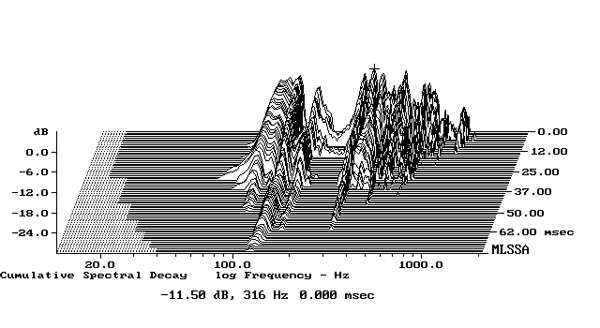
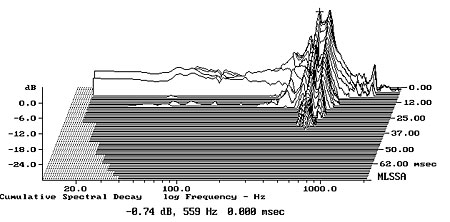
Another thing about those Revel CSD graphs. Why is Atkinson Burying much of the measurement below the graph floor? He does this more on some, and less on others. It's a practice he applies to all the panel measurements for the magazine. I believe that he thinks that under a certain threshold, the measurement is irrelevant. Does this sound plausible? Or is he doing it for a different reason?
Atkinson is not burying any measurements, he is just using the same vertical dB axis scale of 0 to -30 dB (0 to -24 dB scale shown) for comparison. When a baffle vibrates significant less, the waveform does look buried, as long as you hold the 0 to -30 dB vertical scale, because a significant part of that vibration CSD plot is below -30 dB.. In those cases he extends the vertical axis down to lower dB levels, -24 to -54 dB (-24 to -48dB scale shown). So the upper part of the vibration CSD wave form may be above the -24dB to -54 dB scale. Also, notice the crosshair located at the selected peak of the CSD waveform on all the charts, with its dB, frequency, and time (0.00 sec.) given at the bottom of each CSD graph for reference.
A link to a brief discussion by John Atkinson on measuring baffle vibrations. Atkinson has some interesting subjective comments on page 7. :
Measuring Loudspeakers, Part Two Page 6 | Stereophile.com
Last edited:
Twinter
Yes, the "measuring loudspeakers" series is outstanding, and Troels Gravesen for one, recommends that everyone read it.
What you're saying about Atkinson doing panel csd graphs the way he does, I agree with. I think what's happening though, is that diy guys concerned with this issue have a different objective than Atkinson who simply wants to to try to equal the playing field amongst manufacturers, while a designer can look as deeply as he wants under what he thinks is the audibility threshold. It's his choice to make, although looking too deeply can drive one a little looney.")
Yes, the "measuring loudspeakers" series is outstanding, and Troels Gravesen for one, recommends that everyone read it.
What you're saying about Atkinson doing panel csd graphs the way he does, I agree with. I think what's happening though, is that diy guys concerned with this issue have a different objective than Atkinson who simply wants to to try to equal the playing field amongst manufacturers, while a designer can look as deeply as he wants under what he thinks is the audibility threshold. It's his choice to make, although looking too deeply can drive one a little looney.
Last edited:
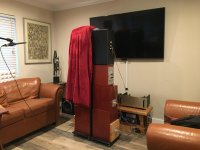
Okay, I have some potentially important information here. I just completed a more rigorous side panel null test, taken at 50”. This is from my phone, so I’ll post an image of the setup first. In a few minutes, I’ll post the measurements through my computer. It all looks very interesting!
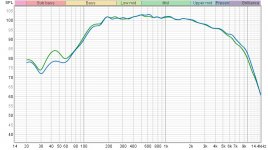
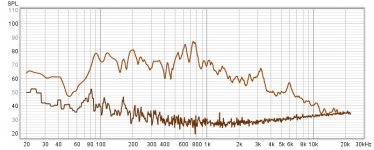
1.The first graph is to test loudspeaker driver matching, so we can see where the cancelation will be off. These were taken for both speakers at exactly 18" and exactly on axis. Measured each speaker 3 times just to make sure.
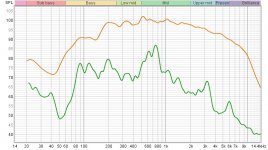
2. A. The second graph is the loudspeaker on axis at 50"(Top trace)
B. The side panel (Null method) with the measurement on axis to center of panel at 50"(Bottom trace)
Now we have to decipher exactly what's going on, and what's not going on
Hint: You can enlarge both images and place one directly below the other to compare. Line up the scales too.
1.The first graph is to test loudspeaker driver matching, so we can see where the cancelation will be off. These were taken for both speakers at exactly 18" and exactly on axis. Measured each speaker 3 times just to make sure.
2. A. The second graph is the loudspeaker on axis at 50"(Top trace)
B. The side panel (Null method) with the measurement on axis to center of panel at 50"(Bottom trace)
Now we have to decipher exactly what's going on, and what's not going on
Hint: You can enlarge both images and place one directly below the other to compare. Line up the scales too.
Attachments
Last edited:
Sorry, but I need to add one more graph of signal to noise for the panel trace to show how noise may be effecting the measurement. Very important! Looks like were pretty good above 90hz, and even better above 170hz. Both traces on the first and second graph(Above) are both true and relative spl!
Attachments
Last edited:
As an example, 1db of differentiation between the speakers at a given frequency in graph "1" will add 1db to the "null method" panel measurement in graph "2" at that same frequency, which is so small compared to the output of the panel, that it's pretty much irrelevant.OK, from plot 2B in post 469, how do we know what is the panel noise and what is left over from the drivers that the null didn't kill?
Last edited:
That is not correct. For example if one speaker radiates 100dB and the other 101 db but out of phase, the summed signal would be 81.7dB. Let's call it 82dB. Now if the measure the side panel using the null method and got 85dB, assuming the sound from the speaker was in phase with the panel, the panel would be radiating at 74.3 dB.
John
I trust your judgement on things like this as much as anyone, but just to make sure.. You are fully aware of how the null method is performed, correct? You've made no mention of it until now. If you do understand how it's performed(And I have to assume you do), then based on what you said, I stand corrected.
I trust your judgement on things like this as much as anyone, but just to make sure.. You are fully aware of how the null method is performed, correct? You've made no mention of it until now. If you do understand how it's performed(And I have to assume you do), then based on what you said, I stand corrected.
Last edited:
That is not correct. For example if one speaker radiates 100dB and the other 101 db but out of phase, the summed signal would be 81.7dB. Let's call it 82dB. Now if the measure the side panel using the null method and got 85dB, assuming the sound from the speaker was in phase with the panel, the panel would be radiating at 74.3 dB.
Just so I can get this straight.. Let's take 750hz, where not only the loudspeakers match "perfectly", but the panels have the highest amplitude resonance. what is your take on that? The relative comparison will help me understand what your explaining in the above statement.
Last edited:
Hey Remlab. What I see in your latest measurements is this:
Illustration 1, post 469 shows measurements of the two drivers on axis at 18". They seem a rather good match and with ideal coupling they should almost cancel out each other.
Illustration 2, post 469 shows A: One speaker on axis at 50". B: Two speakers facing each other in opposite polarity, measured at 50" from the side on the box, the other speaker with blankets over it.
Is that correct?
What I don't know from illustration 2 is the SPl at 50" of the nulled drivers. Is it 10dB lower than a single driver, 20dB lower? We don't know. So what is being measured in plot 2B? Is it the box panels, the residual of the nulled drivers, a combination of both?
The info isn't obvious, if it's there.
It's not going to be easy to measure and separate driver from box, but you might be able to.
Pano
Yes, that's exactly correct.
How about this idea. I could do the "null", but with several thick blankets over each side panel, and the mic placed nearfield and farfield, on axis at where the baffles meet. It wont be perfect(The lower the frequency, the more transparent the blankets become), but it would get us a little closer to eking out more information about what's going on in the lower frequencies.
Last edited:
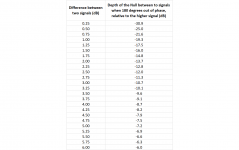
This may be useful. It is a chart which shows the depth of the null we would expect, based on the difference measured between two signals.
Example of how to use the chart: If two signals differ by 0.25 dB, then if one of the signals is 180 degrees out of phase with the other, the resulting null will be -30.9 dB below the baseline signal. The baseline is the higher of the two.
Example: If the two signals are 3 dB apart, then when one is reversed, the null will be -10.7 dB below the higher signal.
Attachments
- Home
- Loudspeakers
- Multi-Way
- Accelerometers to measure panel vibrations?