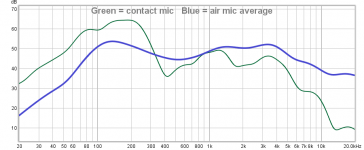
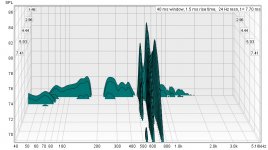
This is what I got from an averaged cone measurement around the piezo position vs the reading piezo itself. This is 1/3 octave smoothed. We can see an exaggerated bass response similar to that found by Remlab.
I used this result as my piezo calibration.
I used this result as my piezo calibration.
Attachments
Hi all,
Thank you for your investigations into cabinet resonations.
Personally, I've found room resonations to be a much bigger problem.
The way i identify them, is by running a single section of my 4-ways, one at a time.
The subs, with a 100Hz low pass, resonate the room strongly.
Never know what in the room or even next room, wants to sing along.
Mids, 100 to 6-800Hz, can do the same, but generally only within the listening room..
The thing is...I would never hear these room resonances if I didn't play play one driver section at a time.
But when I do, they are loud.
Full-range playing masks so many room resonances, ime.
Speakers sound fine and without room resonances, when playing with all sections running. (until high volume).
But again, try them, subs, and mids, alone. Listen to the room.
Anyways, I'm currently led to think cabinet resonance issues are below the SNR radar.

Cabinet resonances affect the "They are here" presentation. Yeah, they are here - but with these annoying artifacts which I wouldnt be hearing if they were really here...
Room resonances affect a "You are there" presentation. Wherever there was, it didnt have stuff in a china cabinet singing along, or that booming sound I'm hearing.
So if the standup bass, drums and piano were actually in my room, the room would behave as it behaves anyway. If something wasnt initially recorded that way, oh well.
I dont know what happens when you convolve a recorded ambient space onto the space of your listening room. I guess it sounds like neither here nor there. Your room better be anechoic then - or not a room; outside then.
Does mere FR adjustments achieve this or get a perceptible step closer in at least that dimension? Just a thought - no one has to answer and jack this thread.
My goal for a very long time has been to reduce all forms of distortion in the system as much as possible, right up to when it leaves the box. Some of those distortions you can hear, and some you can't. Some distortions may sound good, and some don't. It doesn't really matter to me. The loudspeaker, including it's box resonances, are by far the largest source of distortion in a typical system outside of the room, and warrants the most attention(It should be as linear as any piece of electronic equipment, in my opinion). Room acoustics for the most part, are something you're stuck with. I just happen to have very good dimensions in my current room which is much different from my last. Lucky this time around, as far as that aspect goes.
Last edited:
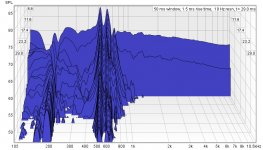
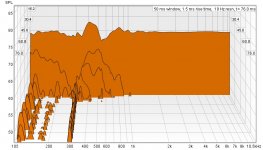
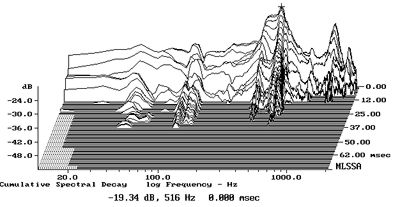
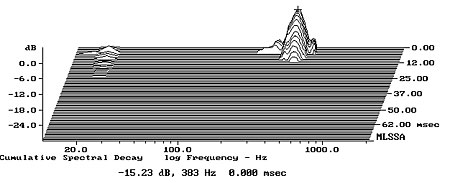
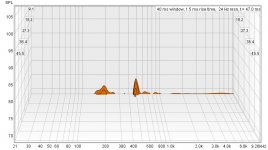
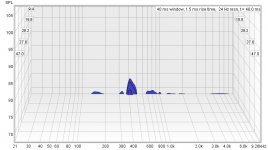
Both of these Stereophile graphs are of the same B&W 805 matrix loudspeaker side panel. The first graph is with the measurement baseline above the floor, and the second graph is with the measurement baseline below the floor. The baseline is where the accelerometer is not picking up any vibration of consequence. In other words, the second graph is what your most likely to hear coming from the cabinet sidewall, while the first graph is giving more information in absolute terms, whether you are likely to hear them or not.
 [/IMG]
Last edited:
I don't understand the purpose of the lowered graphs.
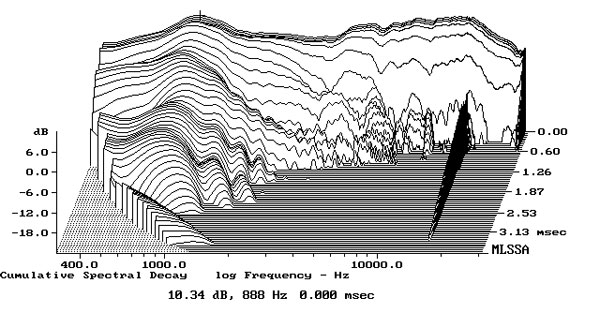
Could you explain what you don't understand in a little more detail? I explained the best I could in the above several posts. Maybe I'm missing something in the explanation. Do you see the straight line in this graph above 2khz? It represents where the accelerometer is no longer picking up vibration. So like John Atkinson is doing on his graphs, I'm dropping that line to just below the floor of the measurement because it's irrelevant. it represents pure silence from the panel. The string resonances you see are from electronic noise getting picked up in the graph.
Is this the correct way to display this graph? Maybe, Maybe not. I'm just trying to emulate what John Atkinson is doing with his panel measurements, which no one seems to have a problem with.
Last edited:
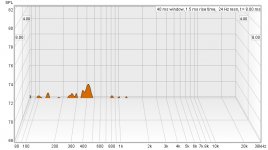
The next two graphs is right vs left speaker. I made a mark on both speakers signifying the exact center(measured), so everything would be as identical as possible. I also placed the accelerometer vibration floor so it is just visible on both speakers. The resonances are extremely low in level but different from each other, which is what you would expect at that level. Tiny differences between cabinet and baffle construction on each speaker are responsible for this discrepancy.
Attachments
Last edited:
Is it? Perhaps I don't understand waterfall plots then. I'll have to do some reading. I thought that the rear most line/slice was the immediate frequency response with each slice coming forward the frequency response going forward in time. I tend to use spectragrams instead, so maybe I'm seeing this wrong.Do you see the straight line in this graph above 2khz? It represents where the accelerometer is no longer picking up vibration.
Bringing the plot down hides ringing as far as I can tell. And the ringing is important to see.
Pano
Your absolutely right about that when it comes to acoustic csd measurements using a microphone with a sound source(This is where the confusion lies). An accelerometer has a vibration floor that is represented by a perfectly straight line. What happens above that vibration floor is the cabinet vibration pulsating outward, and what happens below that vibration floor is cabinet pulsating inward.
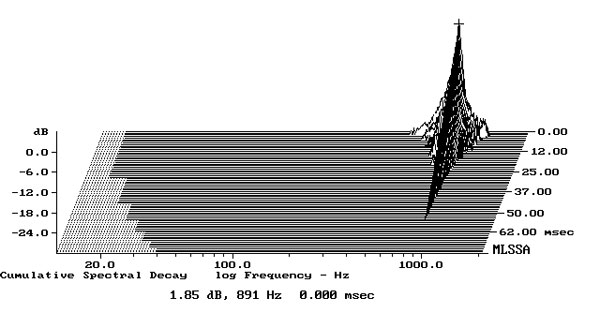
These are two csd charts of the same speaker. One is an acoustic csd measurement and the other is an accelerometer csd measurement of the side panel.
Do you see the difference? He's not showing what happens below the vibration floor of the accelerometer graph because he probably feels that it's irrelevant, as far as audibility goes.
Your absolutely right about that when it comes to acoustic csd measurements using a microphone with a sound source(This is where the confusion lies). An accelerometer has a vibration floor that is represented by a perfectly straight line. What happens above that vibration floor is the cabinet vibration pulsating outward, and what happens below that vibration floor is cabinet pulsating inward.
These are two csd charts of the same speaker. One is an acoustic csd measurement and the other is an accelerometer csd measurement of the side panel.
Do you see the difference? He's not showing what happens below the vibration floor of the accelerometer graph because he probably feels that it's irrelevant, as far as audibility goes.
Last edited:
OK, that makes more sense to me now. However, I'm not using an accelerometer but a contact microphone, which is level sensitive like a normal mic. Zero signal will result in about -120dBfs on a plot. I suppose that given that, the best is to use the waterfall pots as they are used with a normal mic.
One big problem I see with plotting accelerometer measurements on software meant for acoustic measurements are the decay measurements, which have to be looked at differently, as explained above, and the "spl" levels which mean nothing at all. The only way you can do the side panel csd accelerometer amplitude thing is by making sure that the loudspeakers being compared are being played at the same acoustic amplitude levels before doing the comparative accelerometer csd plots, which is what I did when comparing the Dunlavy with my own speaker, and what John Atkinson does with every speaker he tests. For me, it was 95db/1m for both. If you don't level match, the more efficient speaker will look worse on the comparative accelerometer csd than the less efficient speaker, all else being equal.
Last edited:
- Home
- Loudspeakers
- Multi-Way
- Accelerometers to measure panel vibrations?