It would be nice if I could visit your place with a bottle of red, but covid.... 
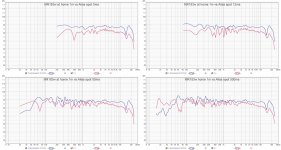
Here is a series of measurements of same speaker at different rooms and distance. First look at Impulse - the echoey room (L speaker at my daughter Alisa) makes the number and magnitude of reflections peaks much higher. Your measurement has even higher number and variation...
Then the responses with different right window gating show the effect of those reflections, and how they change appearance with different gating time.
The speaker is diy by me, it has SEAS MR18 coaxial mid/tweeter and downfire 10" bass. Measurement distance is 1m at home and rouhgly 2,5m at Alisa's room, the treble response goes down with long distance, typically.
The whole thread here SEAS MR18 3-way
Attachments
Last edited:
It would be nice if I could visit your place with a bottle of red, but covid....
I'll be more than happy to have you over. The wine is on me!! Malbec? COVID will be behind us, eventually. When that time comes you will be very welcomed!
In the meantime, I will keep learning. I'm going to come back to your last post a couple times for interpretation. Thanks for sharing!
I was unable to get the measurements re-done today. It might take until next Saturday to have time again. Oh well.
Have a great week!
I was able to make some measurements today:


Took measurements without the TPL, but a) with back box and wings at bottom, b) with back box and without wings, c) without back box and with wings. Although I took top+bottom driver, top, and bottom only, I display only top+bottom for simplicity.
Here's the impulses:

Back box and wings induce cancellations that minimize reflections?
However it looks like my curves have less definition than yours?
Windowing to 10ms:

and 15ms:

and 30ms:

The wings seem to be a keeper. Looks like xo around 250-280Hz should work.
What other conclusions/hints can I draw from these?
- Rotated the table so the MTM is on the narrow end.
- Placed the MTM along the length of the room.
- MTM has 7m behind it to the wall, mic is 90cm away from MTM, and opened the sliding window behind the mic.
Took measurements without the TPL, but a) with back box and wings at bottom, b) with back box and without wings, c) without back box and with wings. Although I took top+bottom driver, top, and bottom only, I display only top+bottom for simplicity.
Here's the impulses:
Back box and wings induce cancellations that minimize reflections?
However it looks like my curves have less definition than yours?
Windowing to 10ms:
and 15ms:
and 30ms:
The wings seem to be a keeper. Looks like xo around 250-280Hz should work.
What other conclusions/hints can I draw from these?
Did some reading on REW Help and went on to overlay energy-time curves in an attempt to better understand reflections. I adjusted t=0 at IR start.

As I interpret these curves they are showing SPL after the initial signal displayed in dB referenced to that initial signal. So I wouldn't be too concerned with nulls but rather with peaks.
My recollection is that reflectins arriving past 5ms are interpreted as "space" rather than blurring the direct sound. I guess this is more relevant for measuring in-room placement of the speakers but it's a starting point.
My other recollection is that reflections weaker than 15dB vs main signal are low enough to be ignored.
Are these recollections true?
Based on the above I'm focusing on peaks at 8.5ms which is -26dB (negligible?) another around 4ms @ -24dB, and the bumps up to 2.5ms. Interesting to note the reflection from 3.8ms to about 5.5ms without the bottom wings is higher than the with wings alternatives.
Zooming into up to 5ms:

It's clear how the no-wings alternative displays higher reflections beyond 2.5ms. Yet 2.7ms equates to 93cm of incremental travel of the reflected sound vs direct sound...likely suspect is the floor bounce in spite of the cushions on the floor. But I'm looking into the design of the MTM so thinking I should focus on the wide bump around 0.65ms at -11dB and the narrower bumps at 1.2ms although this one is already at -19dB.
0.65ms equates to 22cm incremental travel. This is pretty small and further complicated by the fact that I have two drivers playing simultaneously, so here's the overlay of top only bottom only and top plus bottom with back box and bottom wings:

Interestingly both drivers display the bump at 0.65ms and the top driver displays a higher bump 1.5dB above the combined response! Bottom driver is about 2dB lower than the combined. Might this be panel edge diffraction? The panel is 30cm wide so half that is 15cm which is close to 22cm and the bump is wide plus the bottom driver with wings shows a lower bump (I'm guessing the wings contribute to this).
I can use some guidance!
As I interpret these curves they are showing SPL after the initial signal displayed in dB referenced to that initial signal. So I wouldn't be too concerned with nulls but rather with peaks.
My recollection is that reflectins arriving past 5ms are interpreted as "space" rather than blurring the direct sound. I guess this is more relevant for measuring in-room placement of the speakers but it's a starting point.
My other recollection is that reflections weaker than 15dB vs main signal are low enough to be ignored.
Are these recollections true?
Based on the above I'm focusing on peaks at 8.5ms which is -26dB (negligible?) another around 4ms @ -24dB, and the bumps up to 2.5ms. Interesting to note the reflection from 3.8ms to about 5.5ms without the bottom wings is higher than the with wings alternatives.
Zooming into up to 5ms:
It's clear how the no-wings alternative displays higher reflections beyond 2.5ms. Yet 2.7ms equates to 93cm of incremental travel of the reflected sound vs direct sound...likely suspect is the floor bounce in spite of the cushions on the floor. But I'm looking into the design of the MTM so thinking I should focus on the wide bump around 0.65ms at -11dB and the narrower bumps at 1.2ms although this one is already at -19dB.
0.65ms equates to 22cm incremental travel. This is pretty small and further complicated by the fact that I have two drivers playing simultaneously, so here's the overlay of top only bottom only and top plus bottom with back box and bottom wings:
Interestingly both drivers display the bump at 0.65ms and the top driver displays a higher bump 1.5dB above the combined response! Bottom driver is about 2dB lower than the combined. Might this be panel edge diffraction? The panel is 30cm wide so half that is 15cm which is close to 22cm and the bump is wide plus the bottom driver with wings shows a lower bump (I'm guessing the wings contribute to this).
I can use some guidance!
I have never studied reflections like that, but semms to me they are very extremely dependant on distances to walls - impossible to me to draw conclusions.
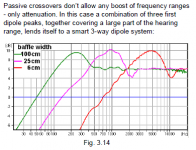
About measurement setup, the table is so large, that it makes extra baffle for a dipole radiator (lower midwoofer)
Basically, with wider baffle low end gets some more dB and response dipole peak and on-axis null shifts lower. In your measurements dipole peak and null are hard to define, perhaps you could use shorter mic distance.
Anyway, all loudspeakers are just bunch of compromises, designer's task is to suppress or hide inevitable problems...
We have Don David Reserve Malbec 2019 today at dinner!
Will try to figure out a smaller measurement table. Got your point!
Your comment about room reflections had me thinking and I went back to the outside measurements. Here's from post #166:
Top driver playing alone:

Bottom driver playing alone:

Both playing together full range:

Interestingly indoors I'm not measuring the trough between 700 and 1200Hz. Moreover, indoors my bottom driver is hitting a null around 315Hz that the outside measurement of the same bottom driver (without wings then) didn't show.
FWIW I applied 20ms right windowing to these apllied 1/12 smoothing to be comparable to above measurements and also used the same scale for ease of comparison:

Also on post #175 I attached the modelled 30cm wide bafffle with top driver showing a peak at 800Hz which seems to be reflected in the top driver response. Seems cutting around the top driver and keeping a minimal baffle around it (1 or 2cm) is in order for experimentation.
Looks like 550Hz might be a good frequency for the inductor to start taking out the bottom driver. What do you think?
Your comment about room reflections had me thinking and I went back to the outside measurements. Here's from post #166:
Top driver playing alone:
Bottom driver playing alone:
Both playing together full range:
Interestingly indoors I'm not measuring the trough between 700 and 1200Hz. Moreover, indoors my bottom driver is hitting a null around 315Hz that the outside measurement of the same bottom driver (without wings then) didn't show.
FWIW I applied 20ms right windowing to these apllied 1/12 smoothing to be comparable to above measurements and also used the same scale for ease of comparison:
Also on post #175 I attached the modelled 30cm wide bafffle with top driver showing a peak at 800Hz which seems to be reflected in the top driver response. Seems cutting around the top driver and keeping a minimal baffle around it (1 or 2cm) is in order for experimentation.
Looks like 550Hz might be a good frequency for the inductor to start taking out the bottom driver. What do you think?
Last edited:
As .5 to compensate for dipole loss, perhaps even lower. But still, both drivers need a high value inductor that cuts above say 200Hz? And the add the .5 inductor to lower mid. Lowpass should be at around 700Hz (to avoid problems around 800-1200Hz, but how low can TPL go? Dipole radiation stops then as well... It's pretty difficult to make xo in a range where driver's response goes upside down and around like that!
The worst problem with dipoles is those narrow band rapid directivity changes just above axial dipole peak (700Hz in your case). Good drivers can take lots of eq boost to compensate for low effeciency, but there is no eq of dsp trick to compensate directivity wiggles. Being able to utilize only 2-3 octaves per driver naturallly leads to 4-way design...
The worst problem with dipoles is those narrow band rapid directivity changes just above axial dipole peak (700Hz in your case). Good drivers can take lots of eq boost to compensate for low effeciency, but there is no eq of dsp trick to compensate directivity wiggles. Being able to utilize only 2-3 octaves per driver naturallly leads to 4-way design...
Attachments
To make sure we are both thinking about the same: I'm designing a 4-way active system where sealed subs cover up to 65Hz (for now) to 18" naked midbasses and from there to the MTM noted above. Crossovers are digital so around 300Hz I cross from the 18" to two 8" and around 1.6kHz crosss to the TPL. The wings by the bottom 8" is to allow it to get lower and of course the second 8" helps too. A naked 8" has a dipole peak at 1.2kHz (simmulated on post #146) so my hypothesis is the 0.5 should reduce "enough" the bottom 8" by 800Hz (per the dipole peak with wider baffle) and enough by 1.6kHz so the center-to-center between a large tweeter and an 8" mid doesn't create big lobing issues.
I guess I could use these curves (top and bottom measured on Friday) into VituixCad and play with the inductor in between. After thinking from your post my starting point would be 400Hz. Makes sense?
Have a great week!
I guess I could use these curves (top and bottom measured on Friday) into VituixCad and play with the inductor in between. After thinking from your post my starting point would be 400Hz. Makes sense?
Have a great week!
I took a jigsaw to the top of the baffle to measure the impact of raising the dipole peak and minimizing the subsequent null. MTM looks ugly, but how does it measure? I did this in low light conditions...and the results are visible...

I also glued the wings to the sides of the bottom midrange, which together with the box around the TPL and the table where the MTM sits really create a U section all around the bottom mid. More like a box without the back. I was expecting this to raise the response at the bottom end and it did:

I applied a 10ms IR window to all and also psychoacoustic smoothing. One is narrrow top baffle measured today and the other is last week's measurement placed in the same place to replicate conditions as much as possible). The improved bottom end response mist have to do with the proper gluing of the wings vs my rough attachment last week.
When measuring the top driver only, above 800Hz the narrow baffle displays higher SPL reflecting the dipole peak moving from 800kHz to about 1200Hz. Seems like good news for the 0.5 approach:

Also measured top + bottom and compared to last week's measurement:

With the wider baffle the response summation is lower beyond 800Hz likely due to the null after the wide baffle dipole peak.
Finally I took today's measurements of the bottom and top drivers, and last week's measurement of the top driver and used VituixCad SPL Trace tool to import into it, and applied an inductor to the bottom driver:

With the wider baffle the null after the dipole peak makes top and bottom drivers output same SPL around 1.5kHz (xo region to TPL) which would likely generate more problems than with the narrow baffle where the top driver is about 5dB above the bottom at the same region, at the cost of a larger inductor.
Thoughts?
I also glued the wings to the sides of the bottom midrange, which together with the box around the TPL and the table where the MTM sits really create a U section all around the bottom mid. More like a box without the back. I was expecting this to raise the response at the bottom end and it did:
I applied a 10ms IR window to all and also psychoacoustic smoothing. One is narrrow top baffle measured today and the other is last week's measurement placed in the same place to replicate conditions as much as possible). The improved bottom end response mist have to do with the proper gluing of the wings vs my rough attachment last week.
When measuring the top driver only, above 800Hz the narrow baffle displays higher SPL reflecting the dipole peak moving from 800kHz to about 1200Hz. Seems like good news for the 0.5 approach:
Also measured top + bottom and compared to last week's measurement:
With the wider baffle the response summation is lower beyond 800Hz likely due to the null after the wide baffle dipole peak.
Finally I took today's measurements of the bottom and top drivers, and last week's measurement of the top driver and used VituixCad SPL Trace tool to import into it, and applied an inductor to the bottom driver:
With the wider baffle the null after the dipole peak makes top and bottom drivers output same SPL around 1.5kHz (xo region to TPL) which would likely generate more problems than with the narrow baffle where the top driver is about 5dB above the bottom at the same region, at the cost of a larger inductor.
Thoughts?
I couldn't help going back and removing the psychoacoustic smoothing on REW measurements, keep the 10ms windowing, and export into VituixCad the measurements done yesterday with the narrow top baffle.
I added an active low pass set at 2000Hz although I now have it set at 1500Hz, kept the active high pass at 250Hz (today playing at 325Hz before wings), and played with how the size of the inductor affected the top end response:

I'm showing 4mH vs 8mH just to show directionally what happens with doubling the value. The bottom graph have the scales expanded to 1 to 3kHz and 60 to 85dB, and show that by 2kHz with the 4mH the bottom driver would be playing about 3dB below the top driver, while with the 8mH the bottom driver would be playnig about 6dB below the top driver. That seems like agood thing. That comes at the cost of loosing 1dB total SPL at 2kHz.
Looking at the whole passband, at 300Hz SPL is at 78.4dB (per VituixCad), and at 2kHz with 4mH it would be at 74.6dB so 3.8dB below, while at 2kHz with 8mH it would be at 73.5dB so 4.9dB down vs 300Hz.
I added an active low pass set at 2000Hz although I now have it set at 1500Hz, kept the active high pass at 250Hz (today playing at 325Hz before wings), and played with how the size of the inductor affected the top end response:
I'm showing 4mH vs 8mH just to show directionally what happens with doubling the value. The bottom graph have the scales expanded to 1 to 3kHz and 60 to 85dB, and show that by 2kHz with the 4mH the bottom driver would be playing about 3dB below the top driver, while with the 8mH the bottom driver would be playnig about 6dB below the top driver. That seems like agood thing. That comes at the cost of loosing 1dB total SPL at 2kHz.
Looking at the whole passband, at 300Hz SPL is at 78.4dB (per VituixCad), and at 2kHz with 4mH it would be at 74.6dB so 3.8dB below, while at 2kHz with 8mH it would be at 73.5dB so 4.9dB down vs 300Hz.
I ran a system recalibration using new crossovers and re-measured with Acourate with both MTMs with wings at the bottom and only one with the narrow baffle top (wife didn't like the looks, but it measures better! So I didn't cut the second baffle). I have not introduced the 0.5 in the MM yet so both playing the full midrange range.
Previous iteration had Neville-Thiele 2nd order xo at 65, 300, 1500Hz. New one is still NT2 but at 65, 275, and 1600Hz.
I listened for a couple of hours and I'm very happy with the improvement. Midbass definition has improved. I haven't decided if lobbing bothers me enough to tackle, but thinking attenuating the bottom 8" might still be good to reduce the attenuation applied by Acourate in the 500-1600Hz region.
In future iterations I'll test raising beyond the 1600Hz to TPL and listen. Need to figure out a minimal baffle that looks good and allows for an almost naked top 8".
Enjoying the journey!


More interesting topic: why might the tweeter be measuring this different indoors vs outoors?
Here's a measurement from post #120 where I measured the TPL-150H open back with the DIY waveguide outdoors:

An yesterday I took a measurement with Acourate to develop the convolution filter. Same TPL, same back DIY waveguide, measured 10 degrees off-horizontal-axis, on-vertical-axis, indoors. This is the uncorrected measurement, with psycho smoothing:

Notice the 9dB reduction from 2.8kHz bottoming out around 5kHz, then up again for the known peak at 8kHz, then 15dB drop to around 15kHz. Very different from measurement outside, where the first dip was 3dB and the second was about 8dB, centered around the same frequencies.
What could be causing this?
Here's a measurement from post #120 where I measured the TPL-150H open back with the DIY waveguide outdoors:
An yesterday I took a measurement with Acourate to develop the convolution filter. Same TPL, same back DIY waveguide, measured 10 degrees off-horizontal-axis, on-vertical-axis, indoors. This is the uncorrected measurement, with psycho smoothing:
Notice the 9dB reduction from 2.8kHz bottoming out around 5kHz, then up again for the known peak at 8kHz, then 15dB drop to around 15kHz. Very different from measurement outside, where the first dip was 3dB and the second was about 8dB, centered around the same frequencies.
What could be causing this?
I think it's not. I'm not positive, but on Acourate one takes the logsweep measurement and in later steps in the development of the filter there is windowing applied.
Thinking about reflections, the ceiling is treated with absorption, the side walls probably not reflecting anything because of dipole + waveguide, so the front and back walls could be. Front wall (behind the speakers) is also absorptive, while back wall has a quadratic diffusor at 7 feet from the mic. Speakers are 85cm from front wall. Tweeter is 105cm from floor. Floor is bare hard floor...although these waveguides are 30 degrees vertical.
Thinking about reflections, the ceiling is treated with absorption, the side walls probably not reflecting anything because of dipole + waveguide, so the front and back walls could be. Front wall (behind the speakers) is also absorptive, while back wall has a quadratic diffusor at 7 feet from the mic. Speakers are 85cm from front wall. Tweeter is 105cm from floor. Floor is bare hard floor...although these waveguides are 30 degrees vertical.
Update: Notch filter on TPL, back waveguide
Somehow I missed Oneoclock's thread last year "Acoustical notch filter for TPL-150", but came across it some time back, got the files and 3D printed the filters for the TPL-150H:

Took measurements in-room, mic at 16cm from edge of waveguide, speaker moved into the room and at a 45 degree angle from walls, 2" fiberglass absorbent on 1st reflection on the floor, 7ms gating. TPL still has the protection cap on.
Here is on axis vertical and horizontal, with backwaveguide on, with vs without notch filter:

A nice improvement is seen in the 7-9kHz region, where the filter is removing about 3dB SPL.
While I was at it, I removed the back waveguide. Here's with filter with and without back waveguide:

You probably noticed on the first measurement how both dropped sharply at 3kHz. That was apparently caused by the back waveguide as it is now gone. Without the back waveguide (a la Spatial Audio X3 & X5 models) I get a smoother response. It's not as smooth as I wished, but it is +/- 3dB SPL from 1.1 to 15.4 kHz.
Note the dips at 6.3kHz (broad) and 15.5kHz (sharp, -4dB SPL).

Here's the impulse response:

Should I be looking at the blips at 5 and 8ms for potential roots causes of the dips at 6.3 and 15.5kHz? Note the scale on the vertical. They seem small in amplitude, but then I'm not experienced to tell their probable significance.
Finally, I measured without the back waveguide, at 60cm, at 0/15/30/45 degrees horizontal:

When looking at the on-axis measurement, I see the dip around 6.3kHz measured at 16cm has moved to 5kHz at 60cm, while the dip at 15.5khz is still there.
I think the response at 15 degrees looks good, and the 30 and 45 look consistent with the 15.
Should I be concerned with 0-deg diping below the 15-deg between 4.4 and 6.6kHz, or does the 5kHx dip on the 0-deg look like a measurement artifact?
Somehow I missed Oneoclock's thread last year "Acoustical notch filter for TPL-150", but came across it some time back, got the files and 3D printed the filters for the TPL-150H:
Took measurements in-room, mic at 16cm from edge of waveguide, speaker moved into the room and at a 45 degree angle from walls, 2" fiberglass absorbent on 1st reflection on the floor, 7ms gating. TPL still has the protection cap on.
Here is on axis vertical and horizontal, with backwaveguide on, with vs without notch filter:
A nice improvement is seen in the 7-9kHz region, where the filter is removing about 3dB SPL.
While I was at it, I removed the back waveguide. Here's with filter with and without back waveguide:
You probably noticed on the first measurement how both dropped sharply at 3kHz. That was apparently caused by the back waveguide as it is now gone. Without the back waveguide (a la Spatial Audio X3 & X5 models) I get a smoother response. It's not as smooth as I wished, but it is +/- 3dB SPL from 1.1 to 15.4 kHz.
Note the dips at 6.3kHz (broad) and 15.5kHz (sharp, -4dB SPL).
Here's the impulse response:
Should I be looking at the blips at 5 and 8ms for potential roots causes of the dips at 6.3 and 15.5kHz? Note the scale on the vertical. They seem small in amplitude, but then I'm not experienced to tell their probable significance.
Finally, I measured without the back waveguide, at 60cm, at 0/15/30/45 degrees horizontal:
When looking at the on-axis measurement, I see the dip around 6.3kHz measured at 16cm has moved to 5kHz at 60cm, while the dip at 15.5khz is still there.
I think the response at 15 degrees looks good, and the 30 and 45 look consistent with the 15.
Should I be concerned with 0-deg diping below the 15-deg between 4.4 and 6.6kHz, or does the 5kHx dip on the 0-deg look like a measurement artifact?
Just to confirm I'm interpreting correctly:
Large as in magnified, hence the variations appear to be more significant than what they really are: +/-3dB. So this is good.
Might the drop at 15kHz be related to the height of the tweeter? I've seen many saying the TPL is tool tall, but don't know how (and if) that manifests on frequency response on the horizontal axis.
Similar to above: I should not worry about this. Good news too!
I guess I should now focus on the midrange!
Thank you!
You are using very large scale...
Large as in magnified, hence the variations appear to be more significant than what they really are: +/-3dB. So this is good.
Might the drop at 15kHz be related to the height of the tweeter? I've seen many saying the TPL is tool tall, but don't know how (and if) that manifests on frequency response on the horizontal axis.
What we hear is average of 0-15(30)deg responses (listening window). All waveguides look problematic on-axis...
Similar to above: I should not worry about this. Good news too!
I guess I should now focus on the midrange!
Thank you!
On to the midrange!
Watching videos from Danny Richie on YouTube about OB he gives some interesting tips. One I like was using a U baffle with different wing lengths so it effectively acts as an off-center driver and spreads difraction out better. Also he uses 100 degree angles for the wings, said to reduce resonances.
I took my existing 30cm-wide MTM OB with the TPL-150H in place and without back waveguide, and tested just the flat baffle, adding a 15cm wing for an L baffle, adding an additional 5cm wing for a U with one 5 and one 15cm wing, and adding a second 15cm wing to have a U with both wings being 15cm. Measured in room, pulled away from walls, mic 60cm away on axis with tweeter, gated at 6ms for the graphs here:

As expected, the flat baffle has less low end extension and peaks higher, the L has higher gain, the 5U15 higher, the 15U15 highest. Yet the last two have a deeper null at 875Hz, about 2dB lower than the L. Would seem the L is a better balance?
The L measured at different horizontal angles:

Drops big time at 875Hz...
Too bad I didn't measure having the 15cm side on the other side: the speaker was at 45 degrees off the front wall and the 15cm wing was on the side closest to the wall. I took one measurement where I tried switching the 5 and 15cm wings to the other side, at 45 degrees off-axis:

In the graph, the orange and purple measurements have the speaker and mic are at the same position, but the purple has the 15cm wing on the side closer to the wall, while the orange has it on the other side. Maybe the big cancellation is a measurement artifact? Been doing some listening with the long wing closer to the wall and I don't hear the hole I was expecting to hear after seeing that frequency response.
I might need to assemble two U with a 15cm and a 5cm wing and try switching the long side to the inside of the listening triangle or the outside and listen for changes. Measuring outside and doing 360 degrees too. Would love to get your thoughts before I jump into that much work
Watching videos from Danny Richie on YouTube about OB he gives some interesting tips. One I like was using a U baffle with different wing lengths so it effectively acts as an off-center driver and spreads difraction out better. Also he uses 100 degree angles for the wings, said to reduce resonances.
I took my existing 30cm-wide MTM OB with the TPL-150H in place and without back waveguide, and tested just the flat baffle, adding a 15cm wing for an L baffle, adding an additional 5cm wing for a U with one 5 and one 15cm wing, and adding a second 15cm wing to have a U with both wings being 15cm. Measured in room, pulled away from walls, mic 60cm away on axis with tweeter, gated at 6ms for the graphs here:
As expected, the flat baffle has less low end extension and peaks higher, the L has higher gain, the 5U15 higher, the 15U15 highest. Yet the last two have a deeper null at 875Hz, about 2dB lower than the L. Would seem the L is a better balance?
The L measured at different horizontal angles:
Drops big time at 875Hz...
Too bad I didn't measure having the 15cm side on the other side: the speaker was at 45 degrees off the front wall and the 15cm wing was on the side closest to the wall. I took one measurement where I tried switching the 5 and 15cm wings to the other side, at 45 degrees off-axis:
In the graph, the orange and purple measurements have the speaker and mic are at the same position, but the purple has the 15cm wing on the side closer to the wall, while the orange has it on the other side. Maybe the big cancellation is a measurement artifact? Been doing some listening with the long wing closer to the wall and I don't hear the hole I was expecting to hear after seeing that frequency response.
I might need to assemble two U with a 15cm and a 5cm wing and try switching the long side to the inside of the listening triangle or the outside and listen for changes. Measuring outside and doing 360 degrees too. Would love to get your thoughts before I jump into that much work
- Home
- Loudspeakers
- Multi-Way
- 3-way open baffle plus subs