Robh3806,
I am changing the way that I read your reply, question, just a little.
If the acoustic curve is "right" what does the twin saddle impedance curve look like?
No worries, this is for fun.
Hello DT
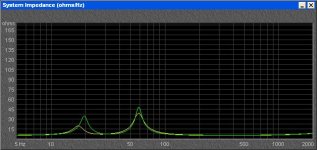
Depends on what you are doing. My last DIY speaker I chose to low tune the box to 26Hz and add a 6dB pump filter to extend and flatten the response. I also had a more typical 32Hz box tuning.
Looking at the impedance curves they follow the pattern where the closer you get FS to FB the more even they get. Green is 32Hz and Yellow is 26Hz.
Only thing I look at is the minimum nothing below 4 ohms.
Rob
")
Attachments
I picture ringing as ringing like a bell.
Like would likely be seen on an oscilloscope as oscillation at the edge of a square wave. In the case of the click test, oscillation when the 1.5volt D-cell is switched off.
A low output impedance power amplifier will negate much of the need for port damping.
In line inductors may help if there is ringing, as parallel capacitors may also help damp ringing. Now we are talking about a crossover.
I am not ready for a crossover yet.
Well, as noted, it's not a question of crossovers per se, but of the LF enclosure / system alignment and behaviour. The ability to assess the speaker's behaviour in this regard it is built into almost all box modelling software in the form of the impulse / step response
Other contemporary methods, albeit less convenient, included using exploding wires, which was a method Bailey favoured, and you can see in his original magazine article on transmission lines. While not particularly useful on the matter of TL design method, his primary object in working with damped pipes was to improve this characteristic, which was a significant weakness in many [not all] contemporary reflex designs. With the easy availability of quality modelling software today, it is now relatively easy to assess this characteristic in advance. As always, it's only as good as what you input, so the more factors you can incorporate, the more accurate it will be, so measurements and empirical analysis via things like the click test are still valuable tools.
Last edited:
Hello,
All those variables, including settling time, are derived or calculated from the impedance / frequency data. If you want to go into the weeds go ahead and calculate or let the software calculate.
I am a hands on engineer; measure first, theory second and math modeling last.
The greater the impedance magnitude and the narrower the Band Width of the frequency peak the more it rings like a bell.
Extended settling time is readily picked off an impedance curve.
Tall and narrow is high Q.
Short and wide is low Q.
Short and wide does not ring.
The tuned vent enclosure trades the tight damped bass of a sealed enclosure for extended bass frequency response.
Varying the enclosure volume and port tuning allows you the ability to tune the alignment that you want within the limits of the selected driver.
Damping
Q factor - Wikipedia
For fun look at these links:
For perspective and more fun.
Build a couple of boxes, pick a couple of different drivers and bolt on an assortment of different size and length ports (with stuffing and without) and plot some impedance curves. If you want to get really wild and crazy calculate the Q at the impedance peaks.
Thanks DT
DualTriode: "I am a hands on engineer; measure first, theory second and math modeling last.
The greater the impedance magnitude and the narrower the Band Width of the frequency peak the more it rings like a bell.
Extended settling time is readily picked off an impedance curve."
Much that's wise in what you say. But the impedance curve is measured, in my experience, with a high output impedance source. So the final implementation in your home also reflects the BL and Qes of the driver powered by an audio amp. (I think the mechanical Q is reflected in the measured impedance curve?)
The high and peaky impedance curves of a driver with high BL is therefore somewhat illusory. It is high because the high BL generates high back-EMF. I don't think the impedance bump is wider? If I remembered any calculus, I could explain how to calculate the derivative of the impedance curve which might be what we really want to know.
BTW, how do the model softwares account for amp output impedance? (Not to mention the speaker placement and room.)
B.
Last edited:
Build a couple of boxes, pick a couple of different drivers and bolt on an assortment of different size and length ports (with stuffing and without) and plot some impedance curves. If you want to get really wild and crazy calculate the Q at the impedance peaks.
Hello DT
Or just run the variations in a simulator why waste time and materials when you can get reliable predictions for a little chair time??
Rob
Hello Ben,
You must be a snow bird?
I fly north in the summer to escape the central California valley heat.
The test amplifier is an Audio Precision APx1701 Transducer Interface; the amplifier output impedance is tiny. There is a 0.01R current sense resistor in series with the amplifier output. The APx analyzer and software calculate all the Theile Small Parameters including Qes, Qms and Qts. Plus the plots. I believe the plots and calculated T/S P to be accurate.
I did run some in room Frequency Response plots without time gating. The floor, walls and ceiling reflections dominate the in room FR plots. I will take the test equipment and speakers out in the redwoods in the backyard and try that. After all that it is on to the FR measurements with software time gating.
You are correct I am having memories of first semester calculus and physics labs.
Hello Rob,
I have the time and materials.
You are correct that the simulators are reliable and repeatable.
I am not so sure what assumptions are wired into the simulators. Nor am I certain that the simulators are accurate. I do not believe that the simulators take stuffing in the box or for that matter stuffing in the port into the calculations.
I have the impression that the resistance added by stuffing in the box or port is not included in the filter calculations built into in the simulation models.
Largely this is for fun.
Thanks DT
Last edited:
I got that idea scratching my head.
I believe that SpeakerDave also posted that.
This is me musing now; I have the impression that stuffing the port with Dacron pillow stuffing will add resistance and also reduce effective cross sectional area at the same time. I do not know this but I believe that it is worth testing. So I am picturing that the stuffing could affect more than one variable at a time.
We will see.
Thanks DT
Well, as noted, I can promise you this much: if you look at any quality piece of modern design software, it will give you the ability to model box losses, internal and vent damping though one cause or another. The algorithms vary a little between packages, but the general accuracy & correlation with measured data is high.
Duct damping in various forms has existed early reflex enclosures and was a popular method of tuning them, usually via the aforementioned click test. It's still sometimes used in various designs, and on a more extreme end, this is basically what an aperiodic (they aren't really aperiodic but we'll never get shot of the name so we roll with it) enclosure is -a resistively vented box. If you look over Troels Gavesen's site, you'll see he has a number of such designs for various purposes, and even the likes of little old me have provided examples on this forum over the years. You can also achieve similar results via frictional losses in very high aspect ratio ducts. Regarding the stuffing / lagging itself, unless you only apply it to specific parts of the duct at a sufficiently high density that the material in effect becomes a solid mass, it won't reduce the CSA per se, but you will certainly otherwise get the damping effects on output and alignment from a baseline undamped condition that you would expect.
Duct damping in various forms has existed early reflex enclosures and was a popular method of tuning them, usually via the aforementioned click test. It's still sometimes used in various designs, and on a more extreme end, this is basically what an aperiodic (they aren't really aperiodic but we'll never get shot of the name so we roll with it) enclosure is -a resistively vented box. If you look over Troels Gavesen's site, you'll see he has a number of such designs for various purposes, and even the likes of little old me have provided examples on this forum over the years. You can also achieve similar results via frictional losses in very high aspect ratio ducts. Regarding the stuffing / lagging itself, unless you only apply it to specific parts of the duct at a sufficiently high density that the material in effect becomes a solid mass, it won't reduce the CSA per se, but you will certainly otherwise get the damping effects on output and alignment from a baseline undamped condition that you would expect.
Hello All,
This is a bit more hands on than sitting at the desk.
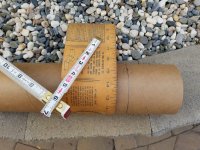
Yesterday I received from Amazon a box containing several Heavy Duty 4 inch ID mailing tubes. Soon to be cut to size to be speaker enclosure test ports. There will be 6 or so ports cut in ½ inch or so increments. To keep the box internal volume constant the port tubes will extend outside the enclosure.
The enclosure is near 2 Ft3. The driver is a JBL 2204H, perhaps if anyone insists, also a JBL 2206H. The test plots will be impedance, phase and a little later Frequency Response. Initially the interest is the shape and slopes of the impedance curves, starting with frequency and magnitude of impedance peaks and to note any changes as a result of the addition of enclosure and port stuffing.
Thanks DT
This is a bit more hands on than sitting at the desk.
Yesterday I received from Amazon a box containing several Heavy Duty 4 inch ID mailing tubes. Soon to be cut to size to be speaker enclosure test ports. There will be 6 or so ports cut in ½ inch or so increments. To keep the box internal volume constant the port tubes will extend outside the enclosure.
The enclosure is near 2 Ft3. The driver is a JBL 2204H, perhaps if anyone insists, also a JBL 2206H. The test plots will be impedance, phase and a little later Frequency Response. Initially the interest is the shape and slopes of the impedance curves, starting with frequency and magnitude of impedance peaks and to note any changes as a result of the addition of enclosure and port stuffing.
Thanks DT
Attachments
Hello All,
Let’s assume that the typical speaker simulation software does an ideal job of selecting woofer box volume and port dimensions.
With that assumption in mind what does the woofer impedance curve look like?
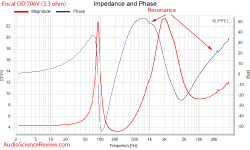
I have spent some time looking at speaker reviews over at AudioScienceReview.com. The bulk of the speaker reviews all of the reviews of real commercial reviews have a impendence plot where the higher frequency of the “twin saddles” has a higher value impedance than the lower frequency saddle.
What does the woofer simulation theory say about that twin saddle impedance curve?
Does the theory match the empirical data?
Thanks DT
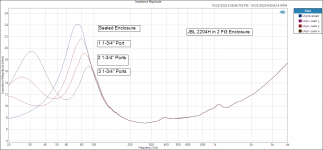
I do have the 1-3/4” drill, drill motor and original speaker from post #1 all together in the same place as the analyzer today. I will rerun the impedance test plots and add one more with additional 1-3/4” port today.
Let’s assume that the typical speaker simulation software does an ideal job of selecting woofer box volume and port dimensions.
With that assumption in mind what does the woofer impedance curve look like?
I have spent some time looking at speaker reviews over at AudioScienceReview.com. The bulk of the speaker reviews all of the reviews of real commercial reviews have a impendence plot where the higher frequency of the “twin saddles” has a higher value impedance than the lower frequency saddle.
What does the woofer simulation theory say about that twin saddle impedance curve?
Does the theory match the empirical data?
Thanks DT
I do have the 1-3/4” drill, drill motor and original speaker from post #1 all together in the same place as the analyzer today. I will rerun the impedance test plots and add one more with additional 1-3/4” port today.
Attachments
For a maximally flat damping, the two impedance peaks should be of equal amplitude.
If overdamped, the higher frequency peak has the higher amplitude.
If underdamped, the higher frequency peak has the lower amplitude.
Tuning at fs may sound 'boomy' and so the overdamped alignment may be preferable, as indicated by your commercial reviews.
If overdamped, the higher frequency peak has the higher amplitude.
If underdamped, the higher frequency peak has the lower amplitude.
Tuning at fs may sound 'boomy' and so the overdamped alignment may be preferable, as indicated by your commercial reviews.
.... and the relationship of impedance, cone motion, and sound output is:
The impedance of a cone driver tattles pretty well the cone motion.
A purpose of the BR concept is to counter-act cone motion by anti-tuning the box you mount it on to somewhere near the driver resonance. But there are trade-offs.
North of the tuned frequency, the port(s) add to the cone motion and help the bass.
At the tuned freq, all bets are off depending.
But below the tuned freq, the port(s) subtract from the cone sound.
So in your mind's eye, you can look at those very nice curves and add or subtract to get the expected speaker sound.
BTW, the box is way too small for that fine Lansing driver. That's why the impedance peak is so darn up the freq scale.
B.
Not as far as I know.
Thought you did!
Early on, amps were very low DF, with = 1 being ideal, so the box was tuned to equal amplitude impedance peaks for the amp to 'track', providing over excursion protection of the then near zero Xmax drivers. Bass extension per se didn't exist early on as the tuning was below the sound source's frequency response, i.e. basically a 'rumble' filter.Later, it did become an added bass extension as recordings increased in LF BW and as power, DF increased, this 'lost' EQ/protection was added in the form of variable DF bass/treble tone controls, allowing more flexible speaker alignments, then when PP, and later, digital electronics came along the driver specs were changed to account for it, i.e. effective motor strength was lowered [higher Qes, Qts] and Vas was often changed to allow a new 'drop-in' replacement in a proven/popular speaker design coupled to a much higher DF amp.
For decades now, the norm for consumer [as opposed to 'mass market'] speakers is to tune 'full range' speakers a bit below Fs [lower rear impedance peak] based on the many various published responses I've seen, presumably to shift GD lower to sound a bit less vented sounding same as I do/recommend for 'HIFI' apps or tune to Fs and use the aforementioned 'click' [impulse] test to optimally damp the system, shifting tuning a bit lower.
GM
The greater the impedance magnitude and the narrower the Band Width of the frequency peak the more it rings like a bell.
Extended settling time is readily picked off an impedance curve.
Tall and narrow is high Q.
Short and wide is low Q.
Short and wide does not ring.
Greets!
Hmm, seems reasonable, but the reality is that a low Qts driver will in comparison have a higher/wider impedance peak at Fs ['ring' less] than an otherwise same driver except higher Qes, Qts.
In 'round' numbers, double Qes = halve the impedance peak and IIRC, halve the BW.
GM
2ft3 is exactly what JBL recommends for this JBL 2204H driver.
Different design goals for different people. If spousal-factor (size of cab) matters a lot, then 2ft3 is great.
But if satisfactory bass is your goal, moving the resonance cut-off of the driver from 45 Hz to 75 Hz, that small box isn't a good choice.
Sims may give the same odd advice. I think the sim is prioritizing the range of flat performance at the cost of low performance. Not a smart trade-off I'd say esp since nobody really likes flat bass, at least at volume levels that preserve your hearing. You shouid have a conversation with your sim just as you have a conversation with the folks who come to paint your house.
B.
Yes I think that it interesting that the simulators probably do target a flat response rather than some single accentuated one note bass thing.
I think that tuning the enclosure is much like equalization or a step in the direction of equalization.
The manufacturers most likely target some neutral curve that will sell the largest number of speakers.
Harmon even has done research to determine the Frequency Response that is most preferred by the largest number of consumers in a standard listening room.
No, that preferred Frequency Response is not flat. It more likely the curve targeted by the simulators looks more and more like the Harmon speaker curve and like the output of the recommended JBL enclosure tuning.
Your individual mileage may vary however, the farther you get from the Harmon Curve the fewer other people will like your fine tuning.
Thanks DT
Thought you did!
I stand corrected.
I probably did at some point (no doubt taught by 'a certain source') but clearly a refresher was needed! Many thanks. - Status
- This old topic is closed. If you want to reopen this topic, contact a moderator using the "Report Post" button.
- Home
- Loudspeakers
- Multi-Way
- Tuning a Base-Reflex enclosure with a impedance curve