An externally hosted image should be here but it was not working when we last tested it.
With tascam you should be able to do it.
An externally hosted image should be here but it was not working when we last tested it.
An externally hosted image should be here but it was not working when we last tested it.
By the way these are my indoor measurements from same speaker measured different part of the same room. 130cm 3.5ms window.
These type of things should be done somewhere else.
An externally hosted image should be here but it was not working when we last tested it.
With tascam you should be able to do it.


By the way these are my indoor measurements from same speaker measured different part of the same room. 130cm 3.5ms window.
These type of things should be done somewhere else.
Thank you. Can't open the first picture. Assuming it's similar to the other two, aren't they a different way of representing the curves I posted over the weekend? In fact, to get these I would need to define a xo point/type/slope, which I understood previous measurements were attempting to help define.
Your two bottom graphs are at different vertical angles, right? What do they tell you to my eyes, directivity was rather narrow and the red areas (big dots) would either be reflections or resonances? Meed to learn how to read these. Have seen the perfect looking graphs from Earl Geddes, FWIW.

Thank you.
You made me realize I needed to build a cable for the feedback loop, which is also useful to create the soundcard calibration file. So have gone down this path an encountered a couple of issues that are now solved but took my weekend time, together with improving the speaker box and assembling a rotation table tool. Oh well.
Hopefully during the week I can take a couple practice measurements per the VituixCAD guide to check if procedure is ok.
I was able to run a set of measurements for the twin 8PE21 per the VituixCAD instructions.
I now have a soundcard REW correction file, I'm using the right channel for timing correction, and made a rotation table to make it easier to measure horizontal dispersion. Also a much thicker panel on the floor to reduce floor bounce reflection. Although I have set REW to run the sweep from to 20 to 24000Hz, per VituixCAD guide, REW is only measuring from 200Hz...puzzling.
Any further feedback before I go into measuring the different series for vertical dispersion every 10 degrees?
Attachments
it´s the 5ms window length which "limit" around 200hz, quick look at distortion fundamental gives it "all"
Thanks for the input. So that was the reason!!
I stopped at 60 degrees just because. Lazy I guess. First want to make sure I'm getting valid data and then measure the whole set. Plus larger angles I imagine are greatly affected by diffraction and this test box is sharp at the angles while the final design I envision will have 2 or 3" radius on edges so these measurements aren't that representative.
Files get too large to upload. That's why I uploaded just a 0° very and 0° horizontal set. Should I upload all sets?
Took more measurements today, vertical dispersion 0-40 degrees and horizontal 0-60 degrees.
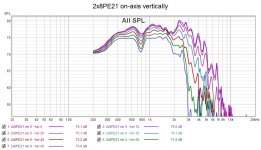
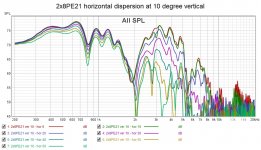
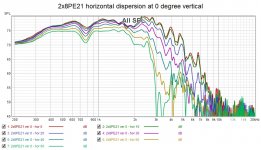
To me it looks like starting at 20 degrees vertical dispersion will be a mess. I guess it's a good thing I'll have a cloud installed over my ceiling. But the floor can't be treated at such low frequencies. I believe the cancellation around 770Hz has to do with the c-t-c distance of 450mm.
Looks ok at 0 and 10 degree vertical, probably up to 1.6kHz.
Thoughts?
Attachments
-
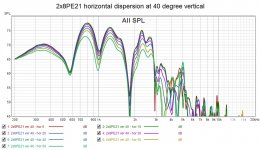 2x8PE21 horizontal dispersion at 40 degree vertical.jpg183.1 KB · Views: 58
 -
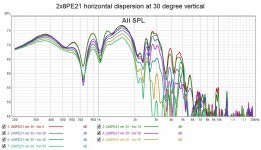 2x8PE21 horizontal dispersion at 30 degree vertical.jpg191.8 KB · Views: 60
 -
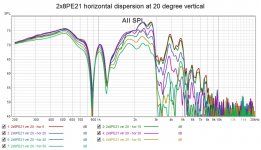 2x8PE21 horizontal dispersion at 20 degree vertical.jpg192.1 KB · Views: 65
 -
 2x8PE21 horizontal dispersion at 10 degree vertical.jpg196.3 KB · Views: 65
 -
 2x8PE21 horizontal dispersion at 0 degree vertical.jpg189 KB · Views: 81


Remember there will be a third radiator involved. The tweeter will bring its own good dispersion around and above the crossover, and will assist a little below the cross. Below this the mids should play well together.Looks ok at 0 and 10 degree vertical, probably up to 1.6kHz.
It is OK to accept some flower petal lobing, if you consider the average power produced.To me it looks like starting at 20 degrees vertical dispersion will be a mess.
It is OK to accept some flower petal lobing, if you consider the average power produced.
Could you please elaborate on the average power produced? I don't think I know what you are referring to.
Thank you!!
Ok, maybe some will think that if there is a null at a small angle, say 15 degrees, then it is ruined and you have to try to get the drivers closer.
Another way to see it is this.. You want output at the listening axis, possibly 0 degrees, that is important. If there is a null at 45 degrees then it will affect the ceiling, you would notice that difference.. but, at 15 degrees this sound might go over your head and to the back of the room. As part of the reverberant field it may be heard, but only a small concern.
Another way to see it is this.. You want output at the listening axis, possibly 0 degrees, that is important. If there is a null at 45 degrees then it will affect the ceiling, you would notice that difference.. but, at 15 degrees this sound might go over your head and to the back of the room. As part of the reverberant field it may be heard, but only a small concern.
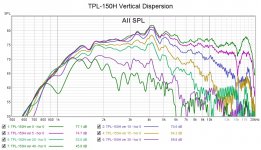
I ran more measurements. This time on the TPL. With a protection cap which explains the low end slope.
Attached the vertical dispersion, measured on axis horizontally. I find it quite interesting. At 5 degrees the response looks good. At 10 degrees the gap vs on axis starts to widen past 5kHz and is 7dB by 10kHz. At 15 degrees at 10kHz the gap is about 11dB.
So if tweeter is to be at ear-level at the listening position which is 2m away from the speaker, the 10 degree angle will be 35cm above ear level. Hence anybody standing by me will hear 10kHz something like 20dB below SPL heard at the listening position (20 degrees). Pretty bad!
Someone standing further behind, at 3m from the speaker would have the 10 degree angle at 1.53m from the floor. So a 1.7m person would likely be at something like 12 degrees and about 9dB down.
So it's going to be a speaker for those sitting down. Which how I listen to music. Both for the one at the sweet spot or those at the couch behind it (heads at 3.4m from speakers).
On the flip side, I will not need to worry about ceiling or floor reflections above 6kHz or so (which 20dB down at 20 degrees).
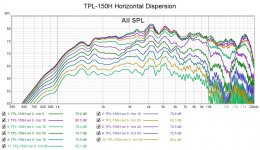
Also attached the horizontal dispersion, vertically on-axis. Up to 20 degrees it looks very good to me across the spectrum. At 30 degrees it drops by 3dB at 10kHz and widens as frequency increases. In my room 30 degrees covers all seats used for listening.
BTW, 1.6kHz looks like a good place to cross it over at.
Thoughts?
Attached the vertical dispersion, measured on axis horizontally. I find it quite interesting. At 5 degrees the response looks good. At 10 degrees the gap vs on axis starts to widen past 5kHz and is 7dB by 10kHz. At 15 degrees at 10kHz the gap is about 11dB.
So if tweeter is to be at ear-level at the listening position which is 2m away from the speaker, the 10 degree angle will be 35cm above ear level. Hence anybody standing by me will hear 10kHz something like 20dB below SPL heard at the listening position (20 degrees). Pretty bad!
Someone standing further behind, at 3m from the speaker would have the 10 degree angle at 1.53m from the floor. So a 1.7m person would likely be at something like 12 degrees and about 9dB down.
So it's going to be a speaker for those sitting down. Which how I listen to music. Both for the one at the sweet spot or those at the couch behind it (heads at 3.4m from speakers).
On the flip side, I will not need to worry about ceiling or floor reflections above 6kHz or so (which 20dB down at 20 degrees).
Also attached the horizontal dispersion, vertically on-axis. Up to 20 degrees it looks very good to me across the spectrum. At 30 degrees it drops by 3dB at 10kHz and widens as frequency increases. In my room 30 degrees covers all seats used for listening.
BTW, 1.6kHz looks like a good place to cross it over at.
Thoughts?
Attachments
Yes. Why?
It's protection. My current amp is dead silent on turn-on, but as part of this development I will be bringing a new amp and would hate to blow a tweeter because of a thump. At the frequencies the tweeter will play the cap should have minimal impact. Currently using 8x 4.7uF in parallel. Could add another one too.
It's protection. My current amp is dead silent on turn-on, but as part of this development I will be bringing a new amp and would hate to blow a tweeter because of a thump. At the frequencies the tweeter will play the cap should have minimal impact. Currently using 8x 4.7uF in parallel. Could add another one too.
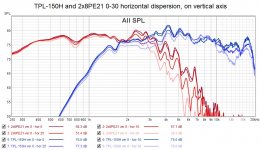
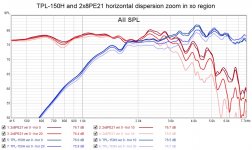
Tweeter plus twin 8PE21 with their horizontal dispersions plotted together. Just 0 to 30 degrees to avoid crowding the graph.
If I were deciding just by horizontal dispersion, I would probably cross it around 2 to 2.2kHz. At2.2khz both TPL and twin 8PE21 drop 2dB at 30 degrees.
Of course the vertical dispersion is the big deal here. I cannot help wonder if my 2x8PE21 vertical dispersion measurements aren't reflecting measurements artifacts such as reflections. Has a comb filtering look to it.
Attachments


- Status
- This old topic is closed. If you want to reopen this topic, contact a moderator using the "Report Post" button.
- Home
- Loudspeakers
- Multi-Way
- Lobing in MTM with TPL-150H and 8PE21