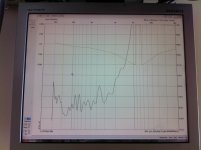
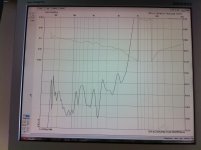
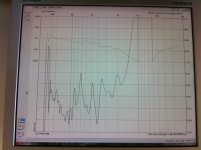
I appear to have gotten better results now?
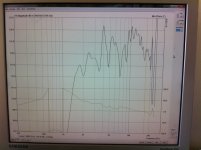
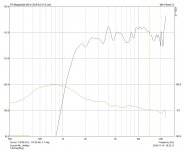
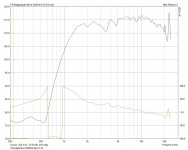
These are tweeter only measurements
The tweeter was protected with LR4 HighPass at 1KHz
This appears to influence the response at what will most probably be the final XO freq around 2.5KHz But will check with future Target Curve overlay.
The Filters added to this trial are:
BoostCut 7KHz Q=7.02 Gain -3dB
BoostCut 3.5KHz Q=3 Gain + 2.5dB
HighShelf 2 at 20KHz Q=0.7 gain +6dB
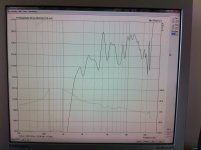
The smoothing has me baffled. 1/1 smoothing gives fluctuation of about +/- 1dB and 1/24 about 7dB
If I'm to flatten the response to about +/- 1dB, i'm fine with 1/1 but way out with 1/24?? What smoothing do I use for freq response flattening?
I presume 1/24 has more resolution?
Returning to the Filters, the 1st BoostCut seems to have overshot taming a peak. The second boostcut could do with some more gain taming the dip and the Highshelf2 doesn't appear to have flattened the slope down. So perhaps change to HighShelf2 at 15KHz Q=1.2 Gain 5dB?
These are tweeter only measurements
The tweeter was protected with LR4 HighPass at 1KHz
This appears to influence the response at what will most probably be the final XO freq around 2.5KHz But will check with future Target Curve overlay.
The Filters added to this trial are:
BoostCut 7KHz Q=7.02 Gain -3dB
BoostCut 3.5KHz Q=3 Gain + 2.5dB
HighShelf 2 at 20KHz Q=0.7 gain +6dB
The smoothing has me baffled. 1/1 smoothing gives fluctuation of about +/- 1dB and 1/24 about 7dB
If I'm to flatten the response to about +/- 1dB, i'm fine with 1/1 but way out with 1/24?? What smoothing do I use for freq response flattening?
I presume 1/24 has more resolution?
Returning to the Filters, the 1st BoostCut seems to have overshot taming a peak. The second boostcut could do with some more gain taming the dip and the Highshelf2 doesn't appear to have flattened the slope down. So perhaps change to HighShelf2 at 15KHz Q=1.2 Gain 5dB?
Attachments

Steve, you don't want to flatten every wrinkle and the 1dB scaling is disturbing visually, 5dB scaling would be enough imo. There is a copy button at the bottom right corner on the frequency response screen, you can save the measurements as pictures instead of photo shots, just a hint.
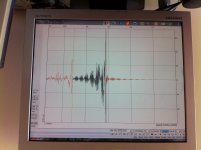
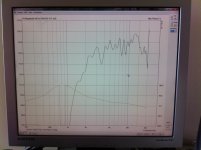
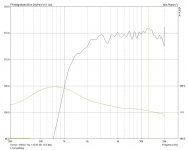
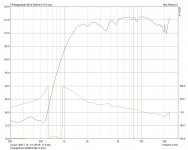
Attached are Impulse with gating
And measurements with correcting filters applied and with 1/1, 1/6 and 1/24 smoothing. These filters were meant to flatten the response of graph of Post 201 which unfortunatel was only shown at 1/1 smoothing.
Anyway the filters on today's graphs are (apart from the protecting LR4 HighPass at 1KHz):
At 3.5KHz BoostCut Q=3 Gain +3dB was to cure dip of approx 2.5dB. Only slightly improved
At 7KHz BoostCut Q=7.02 Gain -3dB was to cure Peak of approx 2dB. Now has become a Dip of -2dB with 1/6 smoothing. Still a small Peak with 1/1 smoothing. Perhaps remove this one?
Slope down from approx 15KHz not really cured with HighShelf2 at 20KHz Q=0.7 Gain +6dB
Perhaps better HighShelf2 at 15KHz Q=1.2 Gain +5dB
Attachments

Just done measurement of Tweeter but with 1KHz HighPass, no other filters.
With 1/1, 1/6 and 1/24 smoothing.
Haven't quite got to grips with this smoothing. These measurement are to guide me to where to flatten and by how much. But what may be a Peak in 1/1 turns out to be a Dip in 1/24, making it difficult to decide whether to flatten?
With 1/1, 1/6 and 1/24 smoothing.
Haven't quite got to grips with this smoothing. These measurement are to guide me to where to flatten and by how much. But what may be a Peak in 1/1 turns out to be a Dip in 1/24, making it difficult to decide whether to flatten?
Attachments
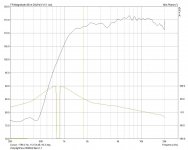

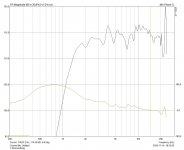
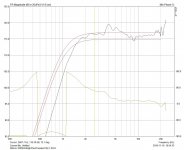
I attach plots of Tweeter measurements. Both with HighPass (protection), but the first without any other filters and the second with filters that I thought would flatten the response.
So the second has the following "flattening" filters:
BoostCut, Freq 2041Hz Q=3 Gain 2dB Hasn't really done much
BoostCut, Freq 3450Hz Q=3 Gain 4dB Seems to have decreased the dip.
BoostCut, Freq 4725Hz Q=3 Gain 3dB Hasn't really done much
HighShelf2, Freq 15000Hz Q=1.2 Gain 5dB This seems to have countered the slope down that started at around 13000Hz. Perhaps overdone and next time have a Gain of 4dB or change the Q??
What sticks out from the "flattened" response compared to no filter response, is the increased peak at approx 4000Hz. No filter was applied at this frequency, which leads me to believe that it has been affected by the filters on either side (at 3450 & 4725). And this leads me to believe that the Q's applied to these adjacent filters are wrong??
Does anyone know of rules/guidelines on how to apply Q's?
Attachments
Anyone know how to select Q value without guessing (too much) i.e. when applying to BoostCuts or High/LowShelves?
And what Q factor select in Target Filter Response, when I would have thought that when selecting XO type, say Linkwitz IV order, already has an associated Q?
And what Q factor select in Target Filter Response, when I would have thought that when selecting XO type, say Linkwitz IV order, already has an associated Q?
There are formulas for calculating Q factors. That said, since there are typically many such curves in a speaker response it is usually difficult to get enough of the issue response to work it out.
Here's a calculator.
Linkwitz Riley, should be 0.5, even order.
Here's a calculator.
Linkwitz Riley, should be 0.5, even order.
Has anyone experience with HFD measurements then filter design?
I think you have Dene?
Now that I have semi mastered taking measurements with ARTA, I'm finding that designing the "flattening" filters for me at least, entails a lot of guesswork and trail and error.
I gather, suspect, that with HFD, especially GRAPHICAL Filter Design, you can upload a measurement, then stretch it, pull it etc until you get the curve you want. Rather than guessing Q's. You can see the effect of changing the values graphically. Is that so?
Is it worth it?
I haven't even managed to take measrements with HFD. I get a whimper hardly audible signal to measure. I would have to turn up the volume on everything a lot, lot more than with the settings on ARTA. Has anyone come across this?
I'm just starting and was able to do some measurements in HFD but did not find a way to combine near- and farfield measurements. There is a possibility to import measurements, did you look at that?
What I found usefull in HFD (4.9) is the possibility to set a flat frequency response. This way you can visualize different filters, Q factors etc.
What I found usefull in HFD (4.9) is the possibility to set a flat frequency response. This way you can visualize different filters, Q factors etc.
- Status
- This old topic is closed. If you want to reopen this topic, contact a moderator using the "Report Post" button.
- Home
- Loudspeakers
- Multi-Way
- Freq measurements and Hypex Filter Design adjustments