I can't see how such simple, elegant and reasonable method can cause so much confusion. Of course it would be "better" to model the entire rear side and it would be "even better" to include the body of a compresion driver (where would you stop?). There could be always caveats like that. But what difference would that made? Has anyone tried that? I believe the differences in the frontal hemisphere would be very small. That's the main reason why it is being done this way after all.
I don't think there's confusion. It looks like objection to me. Just because there is a method(s) does not make it correct for every situation. The IB modelling shortcut does not represent a finite baffle or 4pi space.
Changing the length of the cylinder is a completely different thing and would have the same effect even if the rear side was more "realistic" behind it (again, that would have only a very minor effect, IMO). Shape and size of the edge has still a strong effect on how the wavefront is diffracted behind the horn, but then, along the rear side, the SPL will be too low to make any more difference. At least this it what I would expect
At lower frequencies the sound will wrap around the mouth edge so the depth and mouth edge shape should matter. It becomes less significant with distance back (from the mouth) and the shape will make a difference. The sharp mouth edge should cause more diffraction as well. No one is suggesting a compression driver body, it would make no difference (I tried it to encapsulate the ideal driver membrane
") )
)Your previous models were a single surface horn mounted in an IB. This makes the velocity zero on the IB and the mouth perimeter. I would expect the results to be similar but have differences in 4pi space.
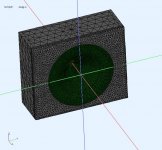
You can use a simple cone to control the baffle width edge and shape to test (approximate) your horn designs. You can also mount it in a box or just make a outer surface the same shape as the inner one. BTW the last 2 are horns based on your calculator (can't remember which version).
.
Attachments
Last edited:
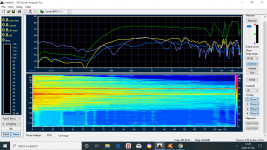
As I have free standing horns, here's a quick measurement, 3ms gating, 8mm thickness of horn wall
Green: At mouth height, on axis
Yellow: At side edge, distance 5mm, mic 90 degree to driver
Blue: At middle side edge, 60cm distance, mic 90 to driver
Violet: Behind horn mouth. halfway to driver, 5mm from horn wall
I planned to attach 50mm wooden piece but work got in the way...
Green: At mouth height, on axis
Yellow: At side edge, distance 5mm, mic 90 degree to driver
Blue: At middle side edge, 60cm distance, mic 90 to driver
Violet: Behind horn mouth. halfway to driver, 5mm from horn wall
I planned to attach 50mm wooden piece but work got in the way...
Attachments
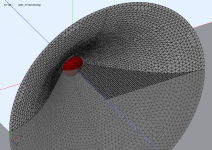
Here is the very first, still only a crude attempt, just to consult the approach. As I have never done this I'm really not sure I'm doing it right.OK, I will try to get these data out of the sims.
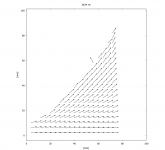
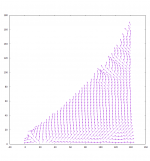
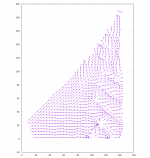
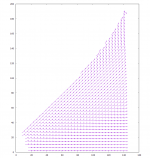
I have a cartesian grid with complex pressure avaiable at each point (on the last picture, this was 4x4 mm). Now it would really help me if someone could write out the formulas for the intensity from that. I've put something together but I'm not sure it can be trusted.
The intensity ifself is complex value - this is the real part. What to expect from the imaginary part of the intensity?

PS - This was a coarse mesh to speed it up for development. Final calculations will be done on much finer data.
PS 2 - I also had to normalize the lenghts of the vectors, otherwise it would not be possible to show them all in one graph.
Attachments


Last edited:
Thanks for that.
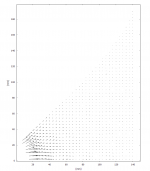
As I feared, it's very hard to see what is going on. Since your analysis planes do not coincide with the wavefronts you get a lot of phase change along the plane.
What would be interesting is to take a bad waveguide, one with a lot of diffraction and see what happens. We know that good waveguide (like you show) don't have much HOMs.
In an OS waveguide we know that the lowest mode travels precisely along the coordinate surfaces, i.e. the wavefronts coincide with the coordinate surfaces. But this only holds in this special case. HOMs will not travel coincident to the coordinate surfaces. So, in an OS waveguide using OS coordinates, any deviation from the above indicates that HOMs are present.
I think I could align the measured points with the OS wavefronts and display deviations in directions of the intensity vectors from normal directions to those wavefronts. Or simply the pressure phases along those contours - that's probably what you meant before.
OK, let me see how those OS coordinates work...
OK, let me see how those OS coordinates work...
Last edited:
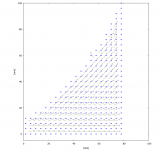
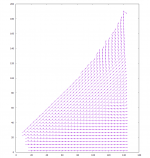
In fact, each point of the current grid already lies on some coordinate surface. If I could find the normal vector to this coordinate surface at that point, I would just show two arrows at each point - the normal and the intensity vector. That would make the presentation much clearer, wouldn't it.
Last edited:
In fact, each point of the current grid already lies on some coordinate surface. If I could find the normal vector to this coordinate surface at that point, I would just show two arrows at each point - the normal and the intensity vector. That would make the presentation much clearer, wouldn't it.
That sounds precisely correct.
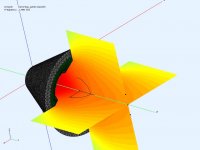
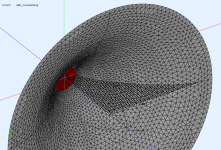
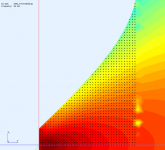
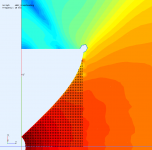
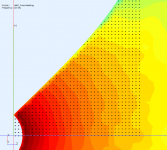
This is a 2" OS throat at 10 kHz. Does it make any sense at all? It looks to me as if there were some simulation problems right near the walls, especially at the throat where the SPL gets higher a little more far down the device. Or could this be realistic?

Attachments
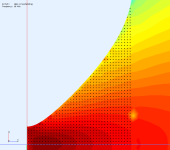
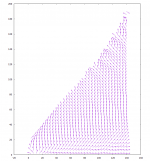
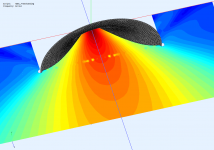
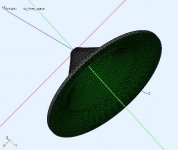
The same conical throat driven by matched spherical wavefront.
Because of the substantially wider beamwidth, mouth reflections are also stronger now.
Because of the substantially wider beamwidth, mouth reflections are also stronger now.
Attachments
Last edited:
- Home
- Loudspeakers
- Multi-Way
- Acoustic Horn Design – The Easy Way (Ath4)