It's no standard and it doesn't have any implications regarding the listening position(s), it's just a form of data presentation, one of many possible. Set it to whatever value you find reasonable. You can also plot the data without normalization but that makes different results far less easy to compare, at least for me. So if you want to normalize the results, you simply have to choose a reference angle. A listening window average as a reference would probably work even better but 10deg seems to work pretty well most of the time. You just don't want an on-axis-only ripple, often still present to some degree, to affect the appearance of all the other data, when it's actually insignificant for all practical purposes - that's the reason why not to choose the on-axis response as a reference.I'm confused how to use NormAngle in ATH reports. [...]
What's independent of any normalization are the DI curves. Obviously, with a good diffraction-free device all are smooth and following each other.
Last edited:
BTW, what's the standard way to calculate an "average" listening window FR from the individual polars? What values should be actually averaged?
This is what they write in ANSI/CEA-2034-A regarding in-room response:

So is this a general approach to averaging frequency responses?
This is what they write in ANSI/CEA-2034-A regarding in-room response:
So is this a general approach to averaging frequency responses?
Last edited:
"Listening Window The listening window curve is a spatial average of the nine magnitude responses in the ±10º vertical and ±30º horizontal angular range. • 0° • ± 10º vertical • ± 10º, ± 20º, ± 30º horizontal"
In VACS calculate with curves works with something like this
ListeningWindow = (( c36^2 + c1^2 + c2^2 + c3^2 + c33^2 + c34^2 + c35^2 + c37^2 + c71^2 ) /9 )^0.5;
The specific numbers would depend on how the observation script was set up, easier to just specify the points needed and then average all of them.
Isn't e.g. "c1" in VACS a complex pressure when working with SPL curves? Then it would be something else (or wasn't?).
"Spatial average of magnitude responses" is not very clear either - that led me to the question. But I guess we should average the squared values of pressure magnitudes and convert that back to SPL. (If I was to choose, I would just average the dB values of SPL but maybe that's not a good way.)
- We don't need any true average here, just a "good representative" of a listening window FR, possibly also smoothed. Normalizing the SPL curves to this reference could then improve the data presentation, so that no single curve alone would be the exact reference, i.e. no local ripple would affect any of them.
Last edited:
I tried a non axisymmetric (the Tritonia) and curve export. Got me a lot of dots in Fusion 360 but nothing further. I'll try it again in the next few days with grid export.For axisymmetric devices the afp file option works best with it's associated plugin. For non axisymmetric devices the Grid export options and plugins is needed. Which one are you trying to use and how far have you got?
Thanks, I have a better idea of how NormAngle is used now. If you wanted to flatten the frequency response of a driver/axisymmetric waveguide using equalization would you place the measurement microphone at the mouth of the waveguide or inside the throat where the compression driver enters the waveguide? I'm confused about whether you'd want to flatten it before external diffraction or if you'd want to flatten it after diffraction further away from the waveguide.
This is what I used in the config file for TritoniaI tried a non axisymmetric (the Tritonia) and curve export. Got me a lot of dots in Fusion 360 but nothing further. I'll try it again in the next few days with grid export.
Code:
GridExport:f360 = {
  ExportProfiles = 0
  ExportSlices = 1
  Scale = 0.1
}
Then use the Ath4_SurfaceImport script and you will get this, turn all the sketches off to see it better, reverse the normal of the surface to make the waveguide surface the front. If you use Curves Import you will have to loft the sketches manually.
If you wanted to flatten the frequency response of a driver/axisymmetric waveguide using equalization would you place the measurement microphone at the mouth of the waveguide or inside the throat where the compression driver enters the waveguide? I'm confused about whether you'd want to flatten it before external diffraction or if you'd want to flatten it after diffraction further away from the waveguide.
But you can't flatten a diffraction - that's why we try to avoid them in the first place. (Well, you can, but only in a very limited subset of the whole space, which is worthless.). For all the crossover/EQ work, always measure far enough from the mouth (>1m).
- Think of normalization simply as an EQ, which it really is. The amount of the EQ is equal to what it takes to make the selected curve a flat line - if you normalize the curves to 10°, you in fact apply an EQ equal to the difference between the 10° curve and a flat line to all the curves (which effectively makes the 10° response a flat line and all the other curves showing the relative difference from the 10° curve).
Last edited:
How important is early reflection directivity index in relation to the sound power directivity index? From alot of klippel measured, higher end speakers with waveguides, they show an ERDI about half that of the DI in terms of dB. Is there any design behind this or does it just naturally correlate with DI? From my understanding its a measurement of how spread out the directivity is: from all the sound power existing in a certain beam width, with zero sound power outside this beam width, to as smooth a change from 0° to 180° as possible, with both scenarios having the same directivity index, is this correct?
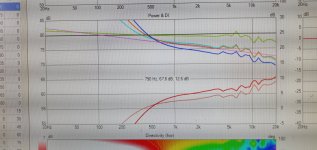
I've attached a VituixCAD window showing the DI and ERDI, red/light red, should I bother trying to further optimise for ERDI and lower it?
My assumption would be to keep ERDI as low as possible without effecting the listening window, as you don't want all your reflections to come from a specific place and rather everywhere, to get a better atmosphere, and less intrusion on locational information.
Attachments
Last edited:
ERDI will almost always be lower than SPDI because it is computed from axes that are closer to the direct axis sound. As you move further away from the main axis the slope of the curve gets steeper. The difference in slope will correspond to the difference between the early reflections curve and the sound power curve. The more omnidirectional the speaker is the more closely those curves will be to each other.How important is early reflection directivity index in relation to the sound power directivity index? From alot of klippel measured, higher end speakers with waveguides, they show an ERDI about half that of the DI in terms of dB. Is there any design behind this or does it just naturally correlate with DI?
The curves describe what is, if a specific directivity is desired then they will indicate whether the result is moving towards or away from the target.
Sound power is the total radiated sound of the speaker in all directions, so by definition it cannot be concentrated. DI curves show the difference between two curves, SPDI being soundpower and listening window, ERDI Early reflections and listening window. The higher the DI the more directional the speaker is, the more the sound is concentrated in a particular direction. For both curves (ERDI and SPDI) to have the same DI the speaker must be completely omnidirectional otherwise there will be a difference.From my understanding its a measurement of how spread out the directivity is: from all the sound power existing in a certain beam width, with zero sound power outside this beam width, to as smooth a change from 0° to 180° as possible, with both scenarios having the same directivity index, is this correct?
The difference between them can also be due to asymmetry of the horizontal and vertical axes. Because CTA 2034 treats vertical and horizontal equally in terms of weighting, any asymmetrical waveguide, for example an elliptical one will show a more steeply rising overall DI. The Horizontal only may have a flat DI, but both together show a steep rise towards higher frequencies. You can also check the Horizontal only DI's in VituixCAD.
If you want your speaker to be more omnidirectional then lower the DI if not don'tI've attached a VituixCAD window showing the DI and ERDI, red/light red, should I bother trying to further optimise for ERDI and lower it?
My assumption would be to keep ERDI as low as possible without effecting the listening window, as you don't want all your reflections to come from a specific place and rather everywhere, to get a better atmosphere, and less intrusion on locational information.
")
The difference between narrow directivity and less early room interaction vs lower directivity and more early room interaction is quite a personal choice. There are trade offs to be had either way and your exposure to different rooms and systems and preferred musical genre for listening can play a large part in which side of the fence you land on, one is not intrinsically better than the other.
If the radiated power was all concentrated to the listening window only, ERDI would be low (theoretically zero but that can hardly happen), even if DI was high (and it would be high in such case). There seems to be a big difference in how these two are actually calculated:
"Sound Power Directivity Index (SPDI)
[...] is defined as the difference between the listening window curve and the sound power curve."
"Early Reflections Directivity Index (ERDI)
[...] is defined as the difference between the listening window curve and the early reflections curve"
- The sound power curve is the frequency response of an imaginary, perfectly omnidirectional source, radiating the same total power. The ER curve is just an average of the actual responses, not "redistributed" to the whole spherical surface around the source. At least this is my understanding of the definitions, maybe I got it wrong (ER - "In each instance a power average [?] of the specified magnitude responses shall be calculated").
Last edited:
So, I think there's some truth to this, although I'm not sure. I should probably add the CEA-2034 curves into my reports, maybe some pattern emerges. I still think these two (SPDI and ERDI) will just go hand in hand in any real situation, without much of a possibility to influence the difference by design.From my understanding it's [ERDI] a measurement of how spread out the directivity is: from all the sound power existing in a certain beam width, with zero sound power outside this beam width, to as smooth a change from 0° to 180° as possible, with both scenarios having the same directivity index, is this correct?
Last edited:
No it is not imaginary in the standard it is all the measurements of the complete Spinorama in a weighted average. The weightings are based on the proportion of that imaginary sphere that each measurement represents.- The sound power curve is the frequency response of an imaginary, perfectly omnidirectional source, radiating the same total power.
http://www.soundstagenetwork.com/gettingtechnical/gettingtechnical200502.htm
https://www.princeton.edu/3D3A/Publications/Tylka_3D3A_DICalculation.pdf
The early reflections are the ones identified by Devantier in "Characterizing the Amplitude Response of Loudspeaker Systems".The ER curve is just an average of the actual responses, not "redistributed" to the whole spherical surface around the source. At least this is my understanding of the definitions, maybe I got it wrong (ER - "In each instance a power average [?] of the specified magnitude responses shall be calculated").
It is imaginary in the sense that it does not exist. Again, the sound power curve is the frequency response of an imaginary, perfectly omnidirectional source, radiating the same total power. That's what the weighting does. That's the power response curve, i.e. power converted to SPL (otherwise there's no way how to display power in SPL chart together with the other SPL curves so that it would make sense, as those are different quantities).No it is not imaginary in the standard it is all the measurements of the complete Spinorama in a weighted average. The weightings are based on the proportion of that imaginary sphere that each measurement represents.
At first, without reading the standard, I would expect the ERDI to be the difference between the early reflections and the sound power curve but that's not how it is defined.
Last edited:
Look at the top chart below, the "SP" is the power response curve. What it actually shows is a frequency response of an ideal omnidirectional source that would radiate the same total power as the examined device. So the power response is real, only its presentation is related to an imaginary source.

The DIs, e.i. the bottom chart, then show how the device deviates from omnidirectional (the differences between selected polars and the power response curve).
The DIs, e.i. the bottom chart, then show how the device deviates from omnidirectional (the differences between selected polars and the power response curve).
Last edited:
That is not how I read what the standard says. I was trying to be helpful but that does not seem to be working. Below a direct quote to avoid misinterpretation.It is imaginary in the sense that it does not exist. Again, the sound power curve is the frequency response of an imaginary, perfectly omnidirectional source, radiating the same total power.
"Sound power represents all of the sounds arriving at the listening position after any number of reflections from any direction. It is the weighted rms average of all 70 measurements, with individual measurements weighted according to the portion of the spherical surface that they represent. Sound power is a measure of the total acoustical energy radiating through an imaginary spherical surface with the radius equal to the measurement distance. Thus the on-axis curve has very low weighting because it is in the middle of other closely adjacent measurement points (see the perspective sketch at the top of Figure 1) and measurements further off axis have higher weighting because of the larger surface area that is represented by each of those measurements. Ideally, such a measurement would be made at equally-spaced points on the entire surface of the sphere, but this simplified spatial-sampling process turns out to be a very good approximation. The result could be expressed in acoustic watts, the true measure of sound power, but for the purposes of this standard it is expressed as sound level, frequency response curve having the same shape. Any bump in the curve that shows up in the other curves (on-axis, early reflections, etc.) and persists through this ultimate spatial average is a notable resonance. Calculation of the sound power curve begins with a conversion from dB to a scalar magnitude. The individual measures of sound pressure are then weighted according to the values shown in Appendix C and an energy average (rms) is calculated using the weighted values. The final average is converted to dB."
But that's what it is, or better said, that's what it is supposed to approximate (given that only H and V data are available).That is not how I read what the standard says.
- Home
- Loudspeakers
- Multi-Way
- Acoustic Horn Design – The Easy Way (Ath4)