..it would probably be...(27" x 14") -
That's about the size I plan to use, albeit with a 1.5" throat so maybe a little deeper.
If I understand correctly then it's not quite axisymmetric, elliptical between the circular throat and mouth.
What's the eccentricity?
How much is OS, how much mouth transition?
What nominal OS beam-width?
And more of an opinion question, what would you use as a crossover frequency?
What do you consider the constraint on crossover frequency?
Best wishes
David
I still find this pure nonsense (a coincidence at least). It is almost funny to state the number like that.... It is consistent with Holland & Newell's findings: horns with an axial depth > 30 cm are likely identified as horns in a controlled blind listening test, with the exception of multicellular horns.
But why?Given the depth, I am afraid the waveguides will also sound (more) like a typical horn, ie "cuppy".
The waveguide below is 25 cm (~10") deep with coverage increased to about 70° nominal (2" throat). Would it sound better? I highly doubt that.
Attachments
Last edited:
Hi David,If I understand correctly then it's not quite axisymmetric, elliptical between the circular throat and mouth.
What's the eccentricity?
How much is OS, how much mouth transition?
What nominal OS beam-width?
And more of an opinion question, what would you use as a crossover frequency?
What do you consider the constraint on crossover frequency?
Attached is the STL file so you could inspect the shape yourself. I use these values of termination parameters almost universally now:
Term.s = 0.7
Term.n = 4.0
Term.q = 0.995
From that I would say that the OS part takes about 1/3 - 2/5 of the depth but as you know, there's no such sharp boundary there. Nominal OS beamwidth is really about 60° horizontally. Vertically the OS contour is not preserved so that starts to beam a little as can be seen from the data. Eccentricity of the ellipse is about 0.7 (it is a superellipse actually with exp=2.1) but I haven't tried a circle, it may be not much different actually - anyone can try that easily. I just like it how it is.
As for the crossover frequency, that depends also on the woofer diameter. The directivity pattern of the horn is opening quite smoothly so that brings several options there. Anywhere the two patterns will match, provided the compression driver used is capable of that.
Attachments
Last edited:
I still find this pure nonsense (a coincidence at least). It is almost funny to state the number like that.
Perhaps it's also a coincidence, but since the publication of this research, hardly any mass-produced horn with a depth >30 cm has been brought to market, with the exception of a few large format cinema diffraction horns (TAD, Sony, Klipsch K402 predecessor) that were previously developed. The K402 and Danley's Synergy horns have a depth > 30cm, but these are basically large conical waveguides (fast flare-rate, wide coverage-angle).
Last edited:
The waveguide below is 25 cm (~10") deep with coverage increased to about 70° nominal (2" throat). Would it sound better? I highly doubt that.
"Better" is subjective in this regard, but I'm quite sure it'll sound slightly less "horny"

Last edited:
What I'm trying to say is that the attempt to correlate a quality of a horn to its depth seems utterly ridiculous to me, it just makes no sense.
A high quality waveguide of that depth also have to be quite big overall, which makes it too big to be practical in many cases. The one above is 27" across - that's not a small horn. A deep horn with a small mouth would be of very little use - it would be quite bad actually.
A high quality waveguide of that depth also have to be quite big overall, which makes it too big to be practical in many cases. The one above is 27" across - that's not a small horn. A deep horn with a small mouth would be of very little use - it would be quite bad actually.
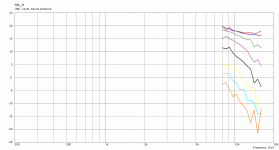
I re-run the sim for 8k - 16k, just kept the coarse mesh. It just narrows... Only a spherical wavefront phase plug would help here...I wonder what the response in the upper octave looks like, since the throat is no longer visible about 30° off-axis.
Attachments
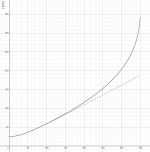
This is the actual (horizontal) profile, along with the OS apart: OS-SE Waveguide... How much is OS, how much mouth transition?
Attachments
Last edited:
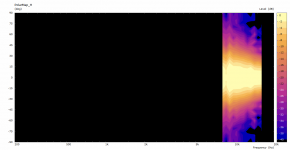
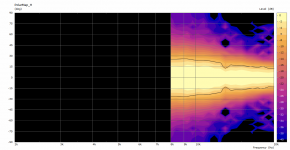
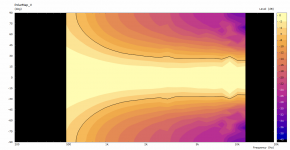
The highest octave again for the 2-inch throat. Not that it is so important, I just have the picture (-6 dB contour lines marked on the map).
- I like this color scheme ("Otto" selection in VACS), it gives much better feeling for where it is actually "hot" and where it is not. Thanks bmc for a hint.
- I like this color scheme ("Otto" selection in VACS), it gives much better feeling for where it is actually "hot" and where it is not. Thanks bmc for a hint.
Attachments
Last edited:
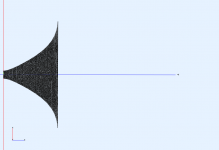
If I were ever to use a large format 2-inch driver as a wide-range source, it would probably be with something like this (27" x 14") -
(There are some numerical defects above 3 kHz, probably still due to mesh coarseness, otherwise it should be pretty smooth.)
Could be fun to put that on Celestion's axi periodic
Celestion Axi2050 - AxiPeriodic Compression Driver
And thanks for the recommendation mabat!
This is the actual (horizontal) profile, along with the OS apart: OS-SE Waveguide
Thank you very much, I find visuals really help to develop some intuition for the numbers.
I was unfamiliar with the Desmos calculator, it looks excellent.
Much better than my old, simplistic, radius transitions.
I wish to make the horizontal beam-width around 80° and limit the vertical to around 50°.
Similar directivity index to your 60° nominal but further from axisymmetry.
The idea is that the narrower vertical will blend better with the inevitable lobe created by the separation of the two sources active at/near crossover.
Have you done any simulations of this problem?
Best wishes
David
I did some analysis and found that this doesn't work as expected. What I found is that the radiation patterns really should match at the crossover frequency, horizontally AND vertically, otherwise you won't achieve smooth power response transition. I would not make the waveguide narrower vertically, if the only motivation was reduction of the spacing. Moreover, it is not necessarily true that the closer the spacing, the better the power response smoothness. It took me some time to realize that. So in the end it's all about pushing the lobes out of direct sound as much as possible. But take this only as my observation as I don't claim this to be universally true - it's still only a somewhat "random" observation, really....The idea is that the narrower vertical will blend better with the inevitable lobe created by the separation of the two sources active at/near crossover.
Have you done any simulations of this problem?
Last edited:
YeahCould be fun to put that on Celestion's axi periodic
Celestion Axi2050 - AxiPeriodic Compression Driver
Unfortunately, I don't have a pair at hand... (Not even a single piece.)
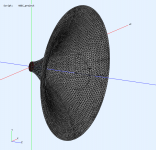
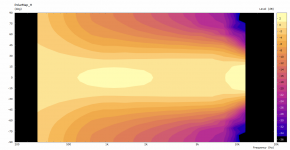
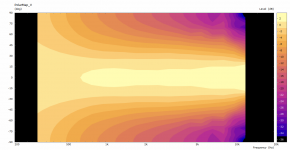
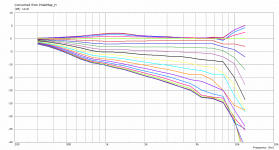
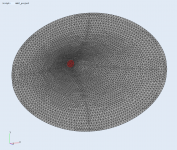
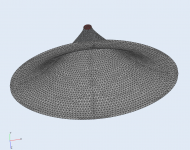
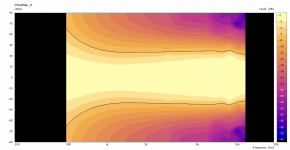
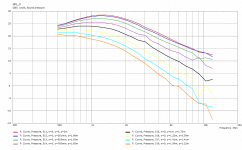
Elliptical waveguide 80x50°, dimensions 740 x 550 x 300 (W x H x D) ~ 29.1" x 21.5" x 11.8", throat 36 mm (1.4").
There will be a pattern flip around 1 kHz.
There will be a pattern flip around 1 kHz.
Attachments
-
 1,4-el80x50-mesh.PNG346.2 KB · Views: 331
 -
 1,4-el80x50-mesh-2.PNG251.1 KB · Views: 324
 -
 1,4-el80x50-mesh-3.PNG158.1 KB · Views: 334
 -
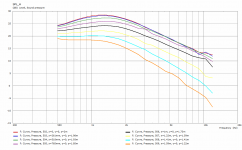
 1,4-el80x50-h.PNG62.7 KB · Views: 354
 -
 1,4-el80x50-v.PNG70.5 KB · Views: 361
 -
 1,4-el80x50-polars-h.PNG36.6 KB · Views: 129
 -
 1,4-el80x50-polars-v.PNG37.7 KB · Views: 114
Last edited:
The highest octave again for the 2-inch throat. Not that it is so important, I just have the picture (-6 dB contour lines marked on the map).
- I like this color scheme ("Otto" selection in VACS), it gives much better feeling for where it is actually "hot" and where it is not. Thanks bmc for a hint.
That scheme is indeed much clearer.
If it's not too much to ask, it would be interesting to compare the plots of the same waveguide with an 1.4" throat.
Last edited:
The differences above ~12 kHz (the default limit that I don't change often) will be so dependent on actual driver that I find spending calculation time on that of little value. I just try to cut it down as much as reasonable, including the mesh density, which is the reason you may see some spurious noise now and then in the data.
The idea is that the narrower vertical will blend better with the inevitable lobe created by the separation of the two sources active at/near crossover.
Have you done any simulations of this problem?
Best wishes
David
I did some analysis and found that this doesn't work as expected. What I found is that the radiation patterns really should match at the crossover frequency, horizontally AND vertically, otherwise you won't achieve smooth power response transition.
This is what I found as well. One gains some things with an elliptical pattern but losses on others. In the end it is not really an improvement, just harder to impliment. Which is why I never went any further with my elliptical device.
- I like this color scheme ("Otto" selection in VACS), it gives much better feeling for where it is actually "hot" and where it is not. Thanks bmc for a hint.
If you're curious, the colorscheme I used is "magma" from matplotlib (the python library I used to generate the plots I posted). Rainbow colorschemes ("Jet" from MATLAB is the classic one) have lots of contrast, but are not perceptually uniform so tend to create "false" features in the data and make it more difficult to discern relative levels.
Here's an interesting talk about how the perceptually uniform colormaps in matplotlib were created.
Thanks for the interesting talk. I think Earl mentioned this quite some time ago and that's also the reason why he used the colors he used in his app. It makes a lot of sense.
What I would also like to change in the polar maps (for a long time) is the scaling of the angular axis from linear to something more representative of the corresponding spherical surface area. The linear scale puts too much emphasis on the axial response, IMHO.
What I would also like to change in the polar maps (for a long time) is the scaling of the angular axis from linear to something more representative of the corresponding spherical surface area. The linear scale puts too much emphasis on the axial response, IMHO.
Last edited:
- Home
- Loudspeakers
- Multi-Way
- Acoustic Horn Design – The Easy Way (Ath4)