A filter can be represented by animpulse response or a frequency, phase response and one can be generated from the other. To cascade two filters simply multiply their frequency responses. and the result is a frequency response of a single filter equivalent to the two cascaded filters.
Mechanically, you can import the IRs representing your FIRs into REW, use REW's multiply function available under the "Controls" button on the right of its main screen, and then export the result back to your FIR generator tool, e.g. RePhase.
Re' reflections
I don't think CD alone vs CD on a horn will serve to isolate mouth reflections; the horn does more than cause a reflection to occur and there may well be a reflection from the bare exit of the CD.
Mouth reflections are early reflections; you can estimate their time of arrival from the horn dimensions. Do a reverse time gate. Instead of looking at every thing before the gate time, look at everything after it. Perhaps this can be done by hand modifying an impulse response. Replace the samples up to the gate time with zeros and see what remains.
A filter can be represented by animpulse response or a frequency, phase response and one can be generated from the other. To cascade two filters simply multiply their frequency responses. and the result is a frequency response of a single filter equivalent to the two cascaded filters.
Mechanically, you can import the IRs representing your FIRs into REW, use REW's multiply function available under the "Controls" button on the right of its main screen, and then export the result back to your FIR generator tool, e.g. RePhase.
Re' reflections
I don't think CD alone vs CD on a horn will serve to isolate mouth reflections; the horn does more than cause a reflection to occur and there may well be a reflection from the bare exit of the CD.
Mouth reflections are early reflections; you can estimate their time of arrival from the horn dimensions. Do a reverse time gate. Instead of looking at every thing before the gate time, look at everything after it. Perhaps this can be done by hand modifying an impulse response. Replace the samples up to the gate time with zeros and see what remains.
Ok, great! Combining the FIR files is much easier than I hoped , thank you.
re reflections. Yes, i don't think CD alone vs CD on a horn will isolate relections either.
I've been looking in the time domain, impulse and spectrographs, for what looks like could be reflections returning to the mouth.
Thanks for the reverse gate idea
Speculating again from the paper, since there is a lot of emphasis on addressing the two-port sub systems individually, they might indeed measure the CD without horn and horn without CD.
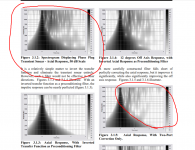
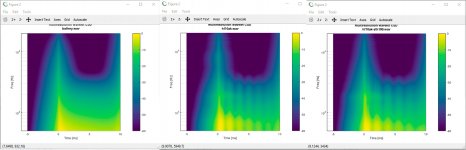
From the pictures, driver response contains mainly upper frequencies smear, and horn response mainly lower frequencies. Image captions also say "phaseplug response" and "horn response". If the CD was involved in the horn response measurement, surely the upper frequency smear would be visible in that image too? Of course I have no other resource or knowledge to confirm any of this other than the Gunnes paper") mark1000, I'm eagerly waiting what you come up with!
mark1000, I'm eagerly waiting what you come up with!
From the pictures, driver response contains mainly upper frequencies smear, and horn response mainly lower frequencies. Image captions also say "phaseplug response" and "horn response". If the CD was involved in the horn response measurement, surely the upper frequency smear would be visible in that image too? Of course I have no other resource or knowledge to confirm any of this other than the Gunnes paper
mark1000, I'm eagerly waiting what you come up with!Attachments
Another quote:
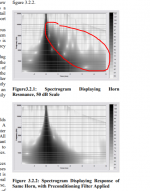
"A discontinuity in a horn’s expansion produces a reflection. A fraction of the sound power reverses course and returns to the compression driver where it is partially absorbed and partially re-emitted, often several milliseconds late. This process is, of course, regenerative, once again producing a decaying series of arrivals. Low frequencies tend to reflect more strongly than high frequencies, so the reflections are most prevalent in the lowest octaves of the horn’s usable range. It is this precise phenomenon that produces an audible artifact commonly described as a “honk”.
The wavefront does not return to the compression driver in a perfectly coherent fashion, but it appears that the bulk of the reflected energy does converge back at the driver. To the extent that it does, the phenomenon acts as a two-port system, and is correctable via signal preconditioning."
So, somehow CD + horn system must be measured as you guys say. Difficulty lies how to extract the "partially re-emitted" sound from the measurement(s). I wish I had time to try measure reflected signal with the CD itself. Too much family activity to conduct measurements at home.
I studied some FIR and adaptive filter basics. Adaptive filters could be great way to get coefficients. It seems though, that if you use a microphone measurement for source signal or target signal for the adaptive filter, it will incorporate the microphone response to the coefficients (through the error),same with all kinds of reflections one will get to the microphone measurement depending on the mic position.
Whatta, could one get the source signal probing accross driver terminals and target signal from probing accross driver equivalent electrical circuit? thus eliminating microphone and its position related errors, as well as most of the driver properties (sans error in equivalent electrical circuit) from signal and target signal, leaving only the acoustic errors for the adaptive filter to calculate coefficients from. How to Simulate Speaker with Equivalent RLC Circuit
Whatta, could one get the source signal probing accross driver terminals and target signal from probing accross driver equivalent electrical circuit?
thus eliminating microphone and its position related errors, as well as most of the driver properties (sans error in equivalent electrical circuit) from signal and target signal, leaving only the acoustic errors for the adaptive filter to calculate coefficients from. How to Simulate Speaker with Equivalent RLC Circuit
Last edited:
The microphone is the least of your problems; just use a calibrated one and include the calibration file in the measurement path. Source errors are not at issue either since the source path can be the same as will be used for listening after adaptation but even if not can be of sufficiently high fidelity not to matter. Of course you need a clean measurement environment to keep out reflections from objects outside the horn mouth.
If you go further with this ask yourself what platform you have available to implement the adaptive algorithm on. You need something you can program directly and that will operate in real time. If you have that and have the requisite programming skills than you have the possibility to get somewhere with this.
If you go further with this ask yourself what platform you have available to implement the adaptive algorithm on. You need something you can program directly and that will operate in real time. If you have that and have the requisite programming skills than you have the possibility to get somewhere with this.
I'm thinking to fix a two-port system, not a changing system. No real time adaptive filter needed since the (two-port) problem is "static", eg. horn dimensions and thus relevant two-port reflections won't change as time goes by. At least thats my current understanding of a two-port system, it doesn't change. One input signal will always result the same output, calculate the coefficients once and it is valid for all signals. Thats why I think it is very difficult to use a microphone measurements to isolate the two-port part from a horn response since the measurement contains a lot of non two-port system stuff as well. As was written in the Gunnes paper, only two-port systems can be corrected for general improvement of the sound. All other corrections affect single point in space only and make response worse elsewhere.
I've got no clue how to implement FIR filter, or how to actually generate one. I think I've heard DSP engines are fed with FIR coefficients and have just read that the adaptive filters will tune coefficients by minimizing error between source and target signals. So, thought that Matlab or similar programs can take a source signal and target signal and output coefficients, that kill the error. The question is how to get proper source and target signals that the error contains only the two-port part.
Oversimplified? probably yes Anyway, just trying to figure this out and hopefully keep the discussion on.
ps. it could be cool to experience sound when an adaptive system adjusts optimal sound for current listening position. A measurement mic taped to a helmet would also look cool well, my wife would propably say goodbye at that point...
I've got no clue how to implement FIR filter, or how to actually generate one. I think I've heard DSP engines are fed with FIR coefficients and have just read that the adaptive filters will tune coefficients by minimizing error between source and target signals. So, thought that Matlab or similar programs can take a source signal and target signal and output coefficients, that kill the error. The question is how to get proper source and target signals that the error contains only the two-port part.
Oversimplified? probably yes
Anyway, just trying to figure this out and hopefully keep the discussion on.ps. it could be cool to experience sound when an adaptive system adjusts optimal sound for current listening position. A measurement mic taped to a helmet would also look cool
well, my wife would propably say goodbye at that point...
Last edited:
Hi all,
I made quick test if it was possible to measure with the driver itself. Turned out it is rather sensitive as a microphone, sounds honky though It didn't work as a mic if power amplifier was connected, the amp must dampen the driver. So, don't know if it is a viable method to try to identify horn reflections back to the driver diaphragm since I don't know how to introduce defined stimulus to the driver other than making a click with a battery.
So I made a transient signal with 1.5v battery with 15ohm resistor in series and measured with ARTA. It propably took the first click when making a contact, I think it would be better to measure when breaking of the contact but have to build quick rig with a switch (now used my fingers to make contact). Sometimes there was two transients, I did multiple measurements and saved the ones that had seemingly had only one transient from the contact.
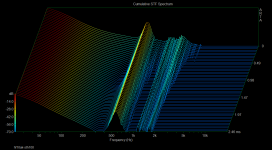
I have FaitalPro hf10ak driver and STH100 horn. Results differ if the STH100 horn was connected or not, so something is measured there, but don't know if thats the reflections or what and if this difference can be analyzed and horn reflections extracted. ARTA STF screenshots and pir files attached.
Any suggestions, ideas or opinions if this was a viable way to take measurements and how to proceed?
I made quick test if it was possible to measure with the driver itself. Turned out it is rather sensitive as a microphone, sounds honky though
It didn't work as a mic if power amplifier was connected, the amp must dampen the driver. So, don't know if it is a viable method to try to identify horn reflections back to the driver diaphragm since I don't know how to introduce defined stimulus to the driver other than making a click with a battery. So I made a transient signal with 1.5v battery with 15ohm resistor in series and measured with ARTA. It propably took the first click when making a contact, I think it would be better to measure when breaking of the contact but have to build quick rig with a switch (now used my fingers to make contact). Sometimes there was two transients, I did multiple measurements and saved the ones that had seemingly had only one transient from the contact.
I have FaitalPro hf10ak driver and STH100 horn. Results differ if the STH100 horn was connected or not, so something is measured there, but don't know if thats the reflections or what and if this difference can be analyzed and horn reflections extracted. ARTA STF screenshots and pir files attached.
Any suggestions, ideas or opinions if this was a viable way to take measurements and how to proceed?
Attachments
Last edited:
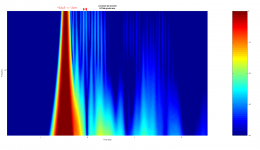
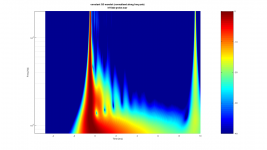
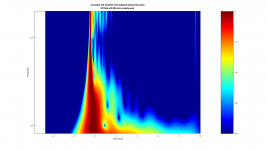
I found old Gnu Octave (similar to Matlab) Wavelet script by Elias Pekonen and tried to put the ARTA exported Wav files through that to get some similar looking graphs as in the Gunnes papers.
http://elias.altervista.org/html/Wavelet_software.html
WTF!? Wavelet TransForm for audio measurements - What-is? and How-to?
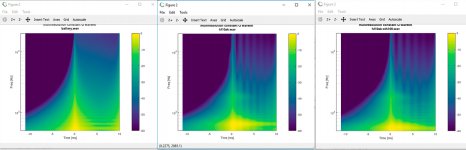
I've got no glue what I'm looking at but it sure looks like there are some echoes in the signal Notice they are closed together without the horn attached, and furher apart and longer with the horn attached. Could the method work?
ps. if you listen to the wav files (previous post), they sound guite different, not sure if it is the battery contact making different sound or if it is the effect of the horn.
http://elias.altervista.org/html/Wavelet_software.html
WTF!? Wavelet TransForm for audio measurements - What-is? and How-to?
I've got no glue what I'm looking at but it sure looks like there are some echoes in the signal
Notice they are closed together without the horn attached, and furher apart and longer with the horn attached. Could the method work?ps. if you listen to the wav files (previous post), they sound guite different, not sure if it is the battery contact making different sound or if it is the effect of the horn.
Attachments
Tried same trick with cone driver FaitalPro 8pr155.
Used L-pad (~16db attenuation) and did measurement the probe between battery and L-pad (attachment #1) and another with probe between L-pad and driver (attachment #2).
Am I right that the result shows cone resonance, since probe before L-pad doesn't show anomalies and probe after L-pad shows? Thinking that the resonance is damped in the L-pad.
Also, without the L-pad the resonances seem larger. Last three attachments show different measurements without L-pad, show almost the same resonances altough the transients from the battery are not that consistent.
I suspended the driver free air and used a switch to trigger signal from a battery. This time made sure the ARTA registers the break signal (make contact before hitting record).
Attachments
-
 8pr155-wo-lpad-hanging-constant-q-3.png500.3 KB · Views: 290
 -
 8pr155-wo-lpad-hanging-constant-q-2.png499.5 KB · Views: 296
 -
 8pr155-wo-lpad-hanging-constant-q-1.png502.6 KB · Views: 301
 -
 8pr155-lpad-pwr-hanging-constant-q.png480.3 KB · Views: 304
 -
 8pr155-lpad-hanging-constant-q.png494.5 KB · Views: 310
 -
8pr155-wav.zip174.1 KB · Views: 32
-
8pr155-ARTA-pir1.zip474 KB · Views: 30
-
8pr155-ARTA-pir2.zip781 KB · Views: 49
Last edited:
Another similar set with the FaitalPro hf10ak with the STH100 horn.
Attachment #1, probe before L-pad
Attachment #2, probe after L-pad
Rest, without L-pad
Basically same setup as above with the 8pr155.
I find it surprising the three different takes again look almost the same
Attachment #1, probe before L-pad
Attachment #2, probe after L-pad
Rest, without L-pad
Basically same setup as above with the 8pr155.
I find it surprising the three different takes again look almost the same
Attachments
-
hf10ak-sth100-ARTA-pir2.zip719.1 KB · Views: 30
-
hf10ak-sth100-ARTA-pir1.zip308.1 KB · Views: 30
-
hf10ak-sth100-wav.zip167 KB · Views: 27
-
 hf10ak-sth100-wo-lpad-3.png484.1 KB · Views: 53
 -
 hf10ak-sth100-wo-lpad-2.png482.1 KB · Views: 50
 -
 hf10ak-sth100-wo-lpad-1.png478.2 KB · Views: 56
 -
 hf10ak-sth100-lpad-pwr.png474.5 KB · Views: 54
 -
 hf10ak-sth100-lpad.png473.5 KB · Views: 59
Last edited:
There you are, hopefully somebody knowledgeable would look at these and suggest what to do next.
I'm not sure if these reveal anything meaningful though. Without the L-pad the system resonates "freely" so the measurements must includes other anomalies than the horn reflections so it is not a two port system in the pictures... Also, the measurements reveal (some of ) what is the environment in the driver diaphragm but not what gets reflected back to the mouth. When there is no amplifier (L-pad) some of the energy that that came back to the driver is absorbed and some bounced back. If there was an amplifier this reflection would be something else. If there was a way to extract what is a reflection from the horn and what is not
I'm not sure if these reveal anything meaningful though. Without the L-pad the system resonates "freely" so the measurements must includes other anomalies than the horn reflections so it is not a two port system in the pictures... Also, the measurements reveal (some of ) what is the environment in the driver diaphragm but not what gets reflected back to the mouth. When there is no amplifier (L-pad) some of the energy that that came back to the driver is absorbed and some bounced back. If there was an amplifier this reflection would be something else. If there was a way to extract what is a reflection from the horn and what is not
Hi again,
I still don't know how to process the data but did some more measurements.
This time I took few mic measurements to compare against, with the same battery click signal. On axis (maybe 2cm out from mouth) and some arbitrary of axis position around 2cm from mouth. Also probed signals from the driver as before with and without the horn.
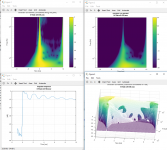
I used the Elias Octave scripts to visualize and made them GIF animations each GIF contains three consequent measurements of each setup.
driver probed
driver + horn probed
mic on axis

mic off axis
ps. path lenght from diaphragm to horn throat is around 3cm and throat to mouth around 9cm. Reflectios from mouth back to diaphragm takes ~0.7ms
I still don't know how to process the data but did some more measurements.
This time I took few mic measurements to compare against, with the same battery click signal. On axis (maybe 2cm out from mouth) and some arbitrary of axis position around 2cm from mouth. Also probed signals from the driver as before with and without the horn.
I used the Elias Octave scripts to visualize and made them GIF animations
each GIF contains three consequent measurements of each setup.driver probed
driver + horn probed
mic on axis
mic off axis
ps. path lenght from diaphragm to horn throat is around 3cm and throat to mouth around 9cm. Reflectios from mouth back to diaphragm takes ~0.7ms
Attachments
Last edited:
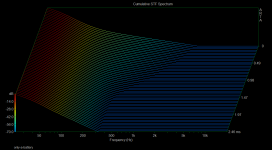
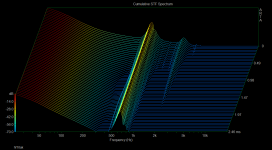
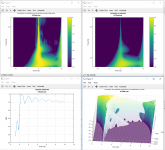
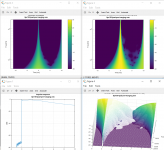
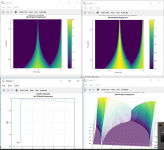
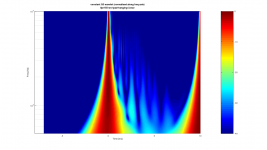
Continuing the monolog, from thread Horn Honk $$ WANTED $$ many of them pictures seem to be constant Q wavelets with Q3, 40db scale 10ms so tried that.
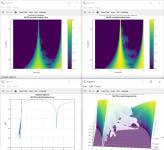
Some riple appeared to the 10kHz up on the new plot settings in the probed measurements. Could this be the Gunnes phase plug problem thingie? I need to open the driver and measure openings in the phase plug to get some dimensions. The riple appears ~63uS apart which is ~2cm sound travel.
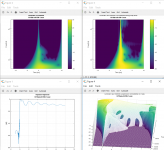
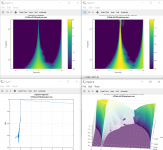
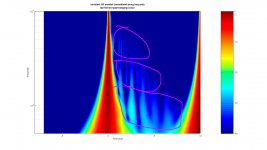
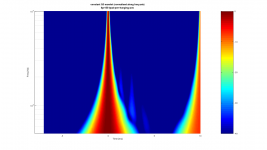
As comparison with same plot setup a mic measurement, where it is hard to see the riple so clearly. First image is zoomed version of the second. Third is a mic measurement as comparison.
Some riple appeared to the 10kHz up on the new plot settings in the probed measurements. Could this be the Gunnes phase plug problem thingie? I need to open the driver and measure openings in the phase plug to get some dimensions. The riple appears ~63uS apart which is ~2cm sound travel.
As comparison with same plot setup a mic measurement, where it is hard to see the riple so clearly. First image is zoomed version of the second. Third is a mic measurement as comparison.
Attachments
Last edited:
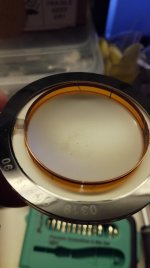
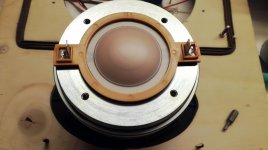
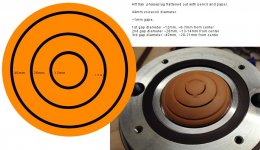
Opened the driver, hf10ak, since nothing else to do 44mm voicecoil, so the ripple in the images is probably just some cone resonance? Anyway, looks like its close to the 3cm estimated path from diaphragm to horn throat. Photos attached if someone wants to see the innards.
ps. the Horn Honk $$ WANTED $$ thread has lotsa info on horn measurement.
Meanwhile been reading how to try the DSP in Octave. Here seems to be good resouce DSP for MATLAB and LabVIEW: LMS adaptive filtering - Forester W. Isen - Google-kirjat
44mm voicecoil, so the ripple in the images is probably just some cone resonance? Anyway, looks like its close to the 3cm estimated path from diaphragm to horn throat. Photos attached if someone wants to see the innards. ps. the Horn Honk $$ WANTED $$ thread has lotsa info on horn measurement.
Meanwhile been reading how to try the DSP in Octave. Here seems to be good resouce DSP for MATLAB and LabVIEW: LMS adaptive filtering - Forester W. Isen - Google-kirjat
Attachments
Last edited:
That L-Pad really puts the electrical brakes on resonance.
Hello,
You are on to something with the L-Pad damping resonance, reflection or ringing.
I have been approaching these thought with impedance plots, Frequency Response Plots and waterfall Plots. If something is ringing it will show up in the plots. For resonance to linger you need the acoustics, mechanics and electronics to all resonate at the same (accidental) tuned frequency.
What I am getting out of the L-Pad is this; one leg of the L-Pad is in series is in series with the voice coil. The other leg of the L-Pad resistance is in parallel with the voice coil. The resistance in series with the VC will damp resonance. The resistance in parallel with the VC will shunt the resonance to ground. Take a look at the attenuator / fixed L-Pad in the JBL M2 monitor, the tweeter output is attenuated by 9db’s that is 75% of the tweeter amplifier power being used in heat in the L-Pad. That L-Pad really puts the electrical brakes on resonance. The reason for the L-Pad is not just about attenuation.
An added thought, connect your DUT to the low impedance output of a quality power amplifier, drive the input of the amplifier with an impulse signal from your signal generator.
Thanks DT
Tried same trick with cone driver FaitalPro 8pr155.
Used L-pad (~16db attenuation) and did measurement the probe between battery and L-pad (attachment #1) and another with probe between L-pad and driver (attachment #2).
Am I right that the result shows cone resonance, since probe before L-pad doesn't show anomalies and probe after L-pad shows? Thinking that the resonance is damped in the L-pad.
Also, without the L-pad the resonances seem larger. ...
Hello,
You are on to something with the L-Pad damping resonance, reflection or ringing.
I have been approaching these thought with impedance plots, Frequency Response Plots and waterfall Plots. If something is ringing it will show up in the plots. For resonance to linger you need the acoustics, mechanics and electronics to all resonate at the same (accidental) tuned frequency.
What I am getting out of the L-Pad is this; one leg of the L-Pad is in series is in series with the voice coil. The other leg of the L-Pad resistance is in parallel with the voice coil. The resistance in series with the VC will damp resonance. The resistance in parallel with the VC will shunt the resonance to ground. Take a look at the attenuator / fixed L-Pad in the JBL M2 monitor, the tweeter output is attenuated by 9db’s that is 75% of the tweeter amplifier power being used in heat in the L-Pad. That L-Pad really puts the electrical brakes on resonance. The reason for the L-Pad is not just about attenuation.
An added thought, connect your DUT to the low impedance output of a quality power amplifier, drive the input of the amplifier with an impulse signal from your signal generator.
Thanks DT
Hi DT,
thanks for your comments! I will revisit measurements with an amplifier within few days. I think I tried already but my probe didn't register any resonances but my test setup might have been wrong. With mic, it works of course.
What do you think, is there any value in these measurements done with battery signal? My thinkin was to eliminate all external circuits from the measurements other than the driver while the measurements are taken. Originally I wanted to see if a compression driver can "mic" reflections back from horn mouth. I'm taking measurement by probing with mic preamp with 2k input impedance and 2k U-pads * from the driver terminals. Of course, in real application the drivers are connected with amp and possibly with crossover networks but these measurements might help to analyze whats cone resonance and what is not in a measurements of a real system (with amp and all) taken with a microphone?
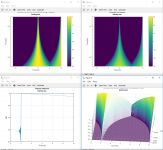
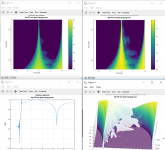
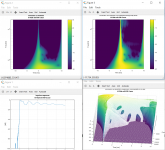
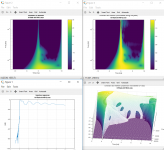
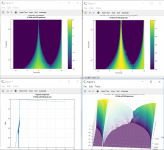
Meanwhile I plotted the last measurement in post #32 with different settings. That would be test signal from battery, without L-pad, probed from the driver terminals. Three separate resonances there?
The top most resonances look similar to whats there in the hf10ak as well. Still not sure if it is just an anomaly with the plot or measurement setup, since I'm not comfortable with the wavelet stuff yet and nobody has given feedback on the battery measurement trick
Regaring Gunnes papers don't know if any of these measurements show sound traveling from voice coil to surround, trough the cone, and back. Speed of sound in the cone material is unknown to me. Quick Googling gives speed of sound for different plastics and paper between 2000-3000m/s. I had assumption couple of posts back where I thought the 63uS ripple in the hf10ak plot in corresponds to ~2cm sound travel. It is 2cm in Air, unknown in the ketone polymer cone, which the ripple is probably from?
* In fact, I had 2k L-pad probes to start (my impedance probe, from ARTA measurement box), and made them U-pads adding series resistor to the negative leg as well. Seems that U-pad series resistors should be half of the L-pad series resistor so have to make new probes and test if there was a difference
Attachments
#1 8pr155, battery signal, no lpad, probed
#2 is #1 with maybe three different resonances?
#3 with L-pad in the circuit while taking measurement
thanks for your comments! I will revisit measurements with an amplifier within few days. I think I tried already but my probe didn't register any resonances but my test setup might have been wrong. With mic, it works of course.
What do you think, is there any value in these measurements done with battery signal? My thinkin was to eliminate all external circuits from the measurements other than the driver while the measurements are taken. Originally I wanted to see if a compression driver can "mic" reflections back from horn mouth. I'm taking measurement by probing with mic preamp with 2k input impedance and 2k U-pads * from the driver terminals. Of course, in real application the drivers are connected with amp and possibly with crossover networks but these measurements might help to analyze whats cone resonance and what is not in a measurements of a real system (with amp and all) taken with a microphone?
Meanwhile I plotted the last measurement in post #32 with different settings. That would be test signal from battery, without L-pad, probed from the driver terminals. Three separate resonances there?
The top most resonances look similar to whats there in the hf10ak as well. Still not sure if it is just an anomaly with the plot or measurement setup, since I'm not comfortable with the wavelet stuff yet and nobody has given feedback on the battery measurement trick
Regaring Gunnes papers don't know if any of these measurements show sound traveling from voice coil to surround, trough the cone, and back. Speed of sound in the cone material is unknown to me. Quick Googling gives speed of sound for different plastics and paper between 2000-3000m/s. I had assumption couple of posts back where I thought the 63uS ripple in the hf10ak plot in corresponds to ~2cm sound travel. It is 2cm in Air, unknown in the ketone polymer cone, which the ripple is probably from?
* In fact, I had 2k L-pad probes to start (my impedance probe, from ARTA measurement box), and made them U-pads adding series resistor to the negative leg as well. Seems that U-pad series resistors should be half of the L-pad series resistor so have to make new probes and test if there was a difference
Attachments
#1 8pr155, battery signal, no lpad, probed
#2 is #1 with maybe three different resonances?
#3 with L-pad in the circuit while taking measurement
Attachments
Last edited:
- Status
- This old topic is closed. If you want to reopen this topic, contact a moderator using the "Report Post" button.
- Home
- Loudspeakers
- Multi-Way
- Measuring horn reflections back into the throat