I have just reviewed the TS measurement process in REW. Could you please outline the impedance measurement circuit that you use as there are a few different approaches (sound card only, separate amplifier, etc)?
Thanks,
George
Highlighted below:
You need the impedance cable here Cables
Note that for REW and ARTA you ideally should use a 100 ohm resistor not 10 ohms as per the diagram.
Some soundcards struggle to drive a speaker directly. If that is the case then using an amplifier to drive the speaker may be needed, but make sure to keep the levels low. Use a 100Hz sine wave and an AC voltmeter to set your voltage to 1V or less. There is a risk that you can fry your soundcards input if you use and amp and don't have some sort of attenuation.
I myself use a Walin Jig II which I made. http://www.raymondaudio.nl/files/jig.pdf
Tony.
Note that I haven't measured any T/S params for a while (so I'm not sure if my focusrite 2i2 will drive a speaker direct). I was using my old Audigy II ZS (which had no problem at all driving a 4 ohm speaker directly) for doing the measurements.
I have also used my LM3886 AMP to drive the speakers, results were pretty much the same so I dispensed with the amp as it was more hassle to set up for testing. The Walin Jig has an attenuator and clipping zenners to protect the sound card from over-voltage, Claudio's simple cable does not.
Tony.
It is harder to get out of the starting blocks than I was expecting with all of the issues trying to get reliable measurements and trying to figure out how reliable the data sheets are. It’s funny because some people say to never design a box until you have the drivers in hand so that you can measure the actual units that you are going to use and some say that unless you have $5k to measure like a mnfg just design from the data sheet and tweak in the box.
Seemed clear cut as I was getting started, now not so much.
George
Seemed clear cut as I was getting started, now not so much.
George
This is just the beginning, just wait til you start doing impedance measurements of your loudspeaker boxes and the result is anything like your box simulations.
If the measurements are good then it should be pretty close.
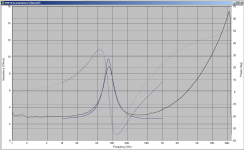
Attached sim (blue) of 2 MW144's in a 10L sealed box, using T/S params measured and averaged from 4 drivers.
Black actual impedance measurement in the box which was actually two separate 5L volumes one for each driver.
Sure it's not a perfect match but it is certainly within the ball park.
I don't have a measurement of my 70L BR or tiny 4" BR cabinets to hand to do a comparison there. Likely they will show much bigger discrepencies, especially the 4" because I used a small slot port rather than a tube.
Tony.
Attachments
Last edited:
...Also I can not read German. Do you have a link?
There is no link to freely download this data, only an option of purchasing the magazine issues 03/02 and 04/02 where it is explained under the section "Tricks of the pro's". This is a fairly simple procedure where you measure the voltage drops, one at the measurement resistor and the other at the DUT. Then you enter these two value in an equation (Ohms law) and get a magnitude value (Z).
If the measurements are good then it should be pretty close.
Attached sim (blue) of 2 MW144's in a 10L sealed box, using T/S params measured and averaged from 4 drivers.
Black actual impedance measurement in the box which was actually two separate 5L volumes one for each driver.
Sure it's not a perfect match but it is certainly within the ball park.
I don't have a measurement of my 70L BR or tiny 4" BR cabinets to hand to do a comparison there. Likely they will show much bigger discrepencies, especially the 4" because I used a small slot port rather than a tube.
Tony.
I am not so positive, what is this graph showing? have you simulated the box for best fit to the measured curve or is it prediction vs result?
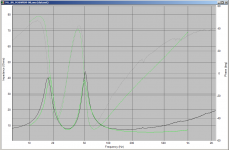
OK here is an M26WR-09-08 in 70L tuned to 32Hz Sim (using factory specs) and actual in box measurement. Note that I can't find the specs that I measured myself right now, which would have been what were used for the original box sim. I suspect that they are somewhere on my desktop which I don't have access to at the moment. Using those specs may be closer or further from the actual measured result.
This is simmed to match what was actually built. ie volume, port diameters and length put into the sim with factory T/S params.
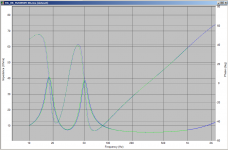
edi: 2nd graph in speaker workshop to show phase as well.
Tony.
This is simmed to match what was actually built. ie volume, port diameters and length put into the sim with factory T/S params.
edi: 2nd graph in speaker workshop to show phase as well.
Tony.
Attachments
Last edited:
i think the agreement is both good and poor, the resonances and tuning frequency is good but not the magnitudes. it looks like there is more series resistance in the measurement then in the simulation, and the actual box seems to be a tiny bit bigger then simulation, and there is a lot less damping material in the box (and the resonance at 275hz, is that the height of the box, ~63cm?)
i am sure there will be some db differencies at the frequency response roll off knee
so, if you adjust the box simulation to match up with the measured impedance curve, which parameter changed the most?
i am sure there will be some db differencies at the frequency response roll off knee
so, if you adjust the box simulation to match up with the measured impedance curve, which parameter changed the most?
I need to find the original measurements of the drivers that were averaged to design the ports for the enclosure. Then it would be more meaningful to tweak for best match.
The box itself is terrible. It is one that I was given in 1985, it is made out of chipboard and does not have any bracing. It originally had a 12" woofer but I made a new front baffle out of MDF when I got the Vifa M26WR09-08's. It was supposed to be a temporary solution till I could build a "proper" box, that was over 20 years ago
Tony.
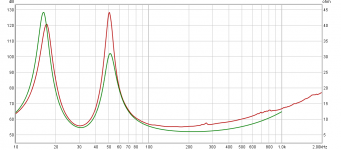
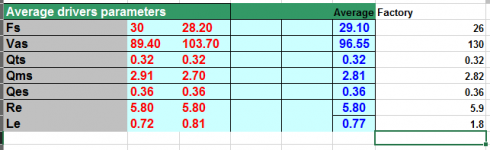
OK here is the sim versus actual with the T/S params that were measured and averaged from two drivers, in some ways closer in others less so. . Interestingly the QTS is identical to factory spec.
2nd attachment, blue is measured T/S and yellow is factory.
Third attachment shows the actual measured values, average of them and the factory specs.
Tony.
2nd attachment, blue is measured T/S and yellow is factory.
Third attachment shows the actual measured values, average of them and the factory specs.
Tony.
Attachments
Last edited:
As can be seened in figure 3.2.3a and 3.2.3b and 3.2.3c in the document posted earlier by ente: http://www.artalabs.hr/AppNotes/LIMP_Tutorial_Version_2_4_English.pdf
even very small differencies makes significant changes to the freq response curve
i am still curious how your simulated box will end up if you try to get the impedance curve to match the measured impedance curve
even very small differencies makes significant changes to the freq response curve
i am still curious how your simulated box will end up if you try to get the impedance curve to match the measured impedance curve
It is harder to get out of the starting blocks than I was expecting with all of the issues trying to get reliable measurements and trying to figure out how reliable the data sheets are. It’s funny because some people say to never design a box until you have the drivers in hand so that you can measure the actual units that you are going to use and some say that unless you have $5k to measure like a mnfg just design from the data sheet and tweak in the box.
Seemed clear cut as I was getting started, now not so much.
George
Hi George,
Your DATS testing system is likely just fine. Don't get discouraged. You have discovered one of the dirty secrets of loudspeaker transducers - each individual one may have rather different specs from what the Manufacturer claims. Variation of up to 30% is not uncommon! Some drivers will vary more than others - it depends on how they are made, quality control by the MFG, etc.
Also, the driver you are measuring is a small fullranger (Fountek FR88EX). The emphasis and goal of the manufacturing is likely not to keep the near-resonance behavior within some tight tolerances.
You might have better luck putting these drivers in a closed box and using some other driver(s) below 150-250 Hz in a woofer plus fullrange configuration. Even a small woofer (5.25") will likely work much better down low than the fullranger. The closed box loading will be MUCH more forgiving of TS parameter differences, and since you will be operating only above 150Hz you are staying just above the resonance region, so what is going on there is less important.
Variation of up to 30% is not uncommon! Some drivers will vary more than others
And what you get also depends on how you take the measures. These are measurements from the same driver, with Fuzzmeasures, and with LMS (facvtory data thrown in for completeness).
There is not “1-set” of T/S parameters.

dave
As can be seened in figure 3.2.3a and 3.2.3b and 3.2.3c in the document posted earlier by ente: http://www.artalabs.hr/AppNotes/LIMP_Tutorial_Version_2_4_English.pdf
even very small differencies makes significant changes to the freq response curve
i am still curious how your simulated box will end up if you try to get the impedance curve to match the measured impedance curve
It's a bit time consuming (since I have to export the ZMA I can't view it in the actual sim) but I'll see what I can do
I think the first thing I'll try changing is the box leakage... Tony.
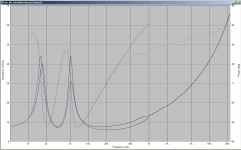
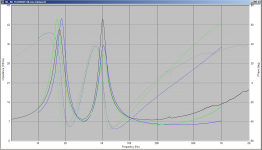
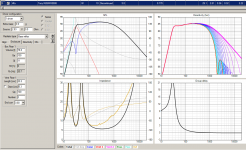
OK after I worked out I could use overlays in vituix cad to compare impedance curves it got a bunch easier. Attached are sims from vituixcad and unibox.
These are using the average params that I had originally used to design the box. none of the T/S params have been modified to get the sim to match.
The one known was the port diameter and length. I couldn't remember the box volume, I thought it was either 70 or 75L but it was not made by me, just used as a non-ideal enclosure for my new woofers (supposedly temporary)... I went for maximum extension, the remake will probably be a BB4 alignment.
The only things changed in the sim were the box volume, the box leakage and the box absorbtion. box volume increased to 78l leakage set to 11, absorbtion set to 100
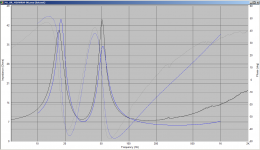
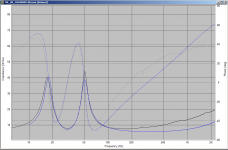
Whilst still not a perfect match the below are much closer.
2nd image is vituix imported into speaker workshop
3rd image is unibox using same params as vituixcad
4th image is comparison of unibox to vituixcad.
Tony.
These are using the average params that I had originally used to design the box. none of the T/S params have been modified to get the sim to match.
The one known was the port diameter and length. I couldn't remember the box volume, I thought it was either 70 or 75L but it was not made by me, just used as a non-ideal enclosure for my new woofers (supposedly temporary)... I went for maximum extension, the remake will probably be a BB4 alignment.
The only things changed in the sim were the box volume, the box leakage and the box absorbtion. box volume increased to 78l leakage set to 11, absorbtion set to 100
Whilst still not a perfect match the below are much closer.
2nd image is vituix imported into speaker workshop
3rd image is unibox using same params as vituixcad
4th image is comparison of unibox to vituixcad.
Tony.
Attachments
Last edited:
Measuring TS params and finding vast differences is something I've struggled with too (and still am), so thank you everyone for all the wonderful information here!
I have a DATS2 as well that I use and have gotten fairly close to spec sheet with some quality sb15nac30-8 drivers I used in a recent project, so from my experience I would say it's possible to get measurements that are reasonable with your equipment, George. To get good measurements, I followed the guidelines outlined in an sb acoustics technical note, particularly the rather vigorous break in procedure running close to xmax with a sine wave at fs for awhile. I think it was 30 mins before I stopped seeing much change in measurement. I also measured ASAP after stopping the break-in, which did make a difference compared with remeasuring a little later. Running immediately after break-in should help get a better match to real world driver behavior under heavy load since components like the voice coil and surrounds can heat up when in use, changing parameters associated with them (Re, Le, Qms, etc).
I have a DATS2 as well that I use and have gotten fairly close to spec sheet with some quality sb15nac30-8 drivers I used in a recent project, so from my experience I would say it's possible to get measurements that are reasonable with your equipment, George. To get good measurements, I followed the guidelines outlined in an sb acoustics technical note, particularly the rather vigorous break in procedure running close to xmax with a sine wave at fs for awhile. I think it was 30 mins before I stopped seeing much change in measurement. I also measured ASAP after stopping the break-in, which did make a difference compared with remeasuring a little later. Running immediately after break-in should help get a better match to real world driver behavior under heavy load since components like the voice coil and surrounds can heat up when in use, changing parameters associated with them (Re, Le, Qms, etc).
- Status
- This old topic is closed. If you want to reopen this topic, contact a moderator using the "Report Post" button.
- Home
- Loudspeakers
- Multi-Way
- Measuring driver parameters vs the data sheet values