If you don't want to have to do math to correct your impedance measurements, you can take very accurate impedance measurements with either a pure voltage source or a pure current source. It doesn't matter which one you use.
If you use a current source to drive the speaker under test, the current source returns a voltage back to AP which is directly proportional to the impedance of the speaker. You don't waste an input channel this way and there is no possibility of damaging the input circuits on the AP.
I can post a schematic later if you are interested.
Hello,
My initial caution with the APx connections was the absence of directions in the APx software manual and the 1701 installation instructions. Sam at AP was very helpful; he wired it all up on his bench and walked me through it. I will check the voltage with a DMM first.
Jack,
In the interest of always learning more please share more of your thought process of saving an instrument connection, please tell me more and pass on a schematic.
Thanks DT
Hello All,
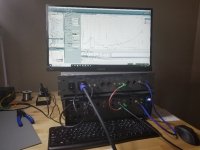
Sparky, the cat, and I have been setting up Sparky’s Lab. First off we have been sorting out the hardware and software to do Thiele Small measurements and calculations.
We think that we will like this AP test gear. The learning curve is really tedious and convoluted. You would expect the documentation to have the use and setup all in one place. It is not that straight forward. It is a lot like computer programming; it can be 98% correct, however put one misplaced check in a box and the entire thing will not run. There is no illustrated guide that shows sample applications with hardware connections and software set to go. No you need to bounce around among the manual chapters and do a considerable amount of trying different stuff. We are keeping a lab daily journal so we can do this again in the future. I think like a teacher, and make a lesson plan for teaching stuff to other folks.
One thing we have learned is that a driver does not have a singular set of Thiele Small Parameters. All these Thiele Small Parameters are calculated from the measured impedance of the driver under test. The pie in the sky concept is that if the impedance is derived with the use of “small signal” voltage, the mechanical / electrical nature will remain constant and that there will be a single constant set of Thiele Small Parameters. This is not true. Change the “small” input voltage a little and the impedance curve will change a little and the Thiele Small Parameters will follow along. Oh well, it is no biggie!
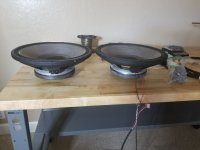
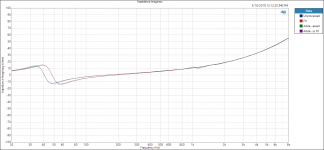
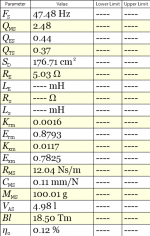
The first project was to measure the Thiele Small Parameters of a JBL 2226HPL woofer. Using 0.5 Volts input. The two sample woofers measured very close to the same values. The Fs of both drivers was very close to 47.5Hz. The factory data sheet says that the Fs is 40Hz. My drivers measure 18.75% higher than the factory specified resonance frequency.
Perhaps it is a break in thing?
See the attachments.
Thanks DT
Sparky, the cat, and I have been setting up Sparky’s Lab. First off we have been sorting out the hardware and software to do Thiele Small measurements and calculations.
We think that we will like this AP test gear. The learning curve is really tedious and convoluted. You would expect the documentation to have the use and setup all in one place. It is not that straight forward. It is a lot like computer programming; it can be 98% correct, however put one misplaced check in a box and the entire thing will not run. There is no illustrated guide that shows sample applications with hardware connections and software set to go. No you need to bounce around among the manual chapters and do a considerable amount of trying different stuff. We are keeping a lab daily journal so we can do this again in the future. I think like a teacher, and make a lesson plan for teaching stuff to other folks.
One thing we have learned is that a driver does not have a singular set of Thiele Small Parameters. All these Thiele Small Parameters are calculated from the measured impedance of the driver under test. The pie in the sky concept is that if the impedance is derived with the use of “small signal” voltage, the mechanical / electrical nature will remain constant and that there will be a single constant set of Thiele Small Parameters. This is not true. Change the “small” input voltage a little and the impedance curve will change a little and the Thiele Small Parameters will follow along. Oh well, it is no biggie!
The first project was to measure the Thiele Small Parameters of a JBL 2226HPL woofer. Using 0.5 Volts input. The two sample woofers measured very close to the same values. The Fs of both drivers was very close to 47.5Hz. The factory data sheet says that the Fs is 40Hz. My drivers measure 18.75% higher than the factory specified resonance frequency.
Perhaps it is a break in thing?
See the attachments.
Thanks DT
Attachments
Last edited:
Hi, how did you get to shrink the woofers down to Sd=176 cm2?
")
GIGO
Garbage IN, Garbage Out.
In this case enter 15 centimeters rather than 15 inches you get square centimeters out.
Interesting, Sparky and I went into her lab this morning before turning up the heat. The 2226HPL resonate frequency went up to 50Hz over night. Temperature does make some things stiffer.
Thank You DT

Actually, Sd = effective piston area, not frame size, which in the case of the 2226 and its variants is ~137"^2/880 cm^2:
https://www.jblpro.com/pages/pub/components/2226.pdf
This impacts other T/S specs, so need to start over and if this software requires starting with an effective diameter, then: [880*4/pi]^0.5 = 33.457 cm: Thiele Small parameters equations - How each one affects the others
GM
https://www.jblpro.com/pages/pub/components/2226.pdf
This impacts other T/S specs, so need to start over and if this software requires starting with an effective diameter, then: [880*4/pi]^0.5 = 33.457 cm: Thiele Small parameters equations - How each one affects the others
GM
Several issues here.
1) You can't measure the driver on its back. The moving parts are going to sag some into a stiffer part of the suspension's range. This will result in lower Cms and higher Fs. Also the air load is increased when the driver cone is this close to the table surface.
The driver must be held with its central axis parallel to the ground. You can do this by cutting out a Vee block and then screwing this into the top of your work bench at the front edge with the Vee on top. This gives the magnet of the driver a saddle to sit in. Then get a bar clamp. Cut a slot in the table behind where the magnet will be. Take he clamp apart. The fixed end of the bar should be under the table. The moving end will now be above the table. You can use it to clamp the magnet from its OD.
https://www.homedepot.com/p/TEKTON-36-in-Ratchet-Bar-Clamp-42-in-Spreader-39186/205606940
2) You must excite the driver to minimize creep in the suspension before measuring. This is done by driving the woofer with a sine wave at Fs for a certain period of time, then letting it cool for a certain period of time, before measuring.
It's a myth that drivers "break in". They change behavior over the short and mid term when exercised and/or are heated up, but they return to the exact same state after resting for a period of time. Below is a link to a report on some of these issues. I don't have the original file, only a printout of it and the graphs are really small, so I had to scan it at a really high resolution. You'll have to download each of the pages from the link below, if you want to read it.
Dropbox - TSP - Simplify your life
In particular look at figures 7 and 8 and the associated text. Notice how in Fig 8, Fs decreases each time a new measurement is made? The driver is becoming more compliant from the measurement excitation.
3) I assume that you are using AP to measure the impedance curves, then using some software to look at the resulting data points and calculate the TSPs from it. Correct?
If this is the case, you are wasting a lot of accuracy in your test equipment. When you make an impedance curve by sweeping the driver with a sine wave, you can get significantly different curves depending on which direction the sweep runs (high frequency to low frequency or vice-versa). This has to do with how nonlinear the suspension and BL curves are in the driver. The worse they are, the more different the curves will be.
Another problem with this technique is that you are putting much more heat into the driver than you need to for the data you need to measure. You are sweeping it across its entire bandwidth, especially right through the impedance minimum around 4*Fs.
To get the best use of the AP, you should program it to search for Fs, by finding zero phase. Once that is done, record the Fs frequency and impedance magnitude. From that data and knowing the drivers Re (measured before testing starts), AP can automatically be programmed to find the -3dB points on the impedance curve. These frequencies are recorded. Then the driver is perturbed somehow. This is normally done by adding a known mass or installing it in a box. Then a second impedance curve is taken. The FS shift is then used to calculate a number of other driver parameters.
Both adding mass and installing the driver in a box to look at the Fs shift have problems associated with them. By far, the best method for determining the drivers mass or compliance is to use an added mass, but with before and after SPL sensitivity measurements used to determine the drivers moving mass. This avoids an entire area of nonlinearity in the drivers behavior.
I'll post more about this later, when I have time.
I've attached the formulas needed for calculating all of the driver parameters from these measurements using both the mass and compliance perturbation techniques.
Attachments
Hello All,
Thanks for the insights.
At this point it is more about kicking the tires and getting the machine started. Sorting out how to find the software check box to turn on the amplifier was on the learning curve and not in the manual.
Jack the software including waterfalls and polar plots is part of the APx500 v4.6 software download from AP.com. It is all in there. The APx 1701 Transducer Test Interface is not documented very well.
I have the machine operational. Inputting the precise driver diameter, vertically mounting the driver basket and other details will follow later. I wanted to work with a known commodity and compare the results to the OEM datasheet.
Next step is to connect the calibrated microphone, see about turning on the phantom power, loading the correction curve and testing driver frequency response.
Inch by inch.
Thanks DT
Hello,
I got the microphone and frequency response thing going. A couple plots are posted over here.
https://www.diyaudio.com/forums/mul...waveguides-experience-mpro-8.html#post5734961
and here
https://www.diyaudio.com/forums/mul...waveguides-experience-mpro-8.html#post5735909
Next steps are fabricating a speaker positioning turntable, you know a lazy Susan, and measuring on and off axis frequency response.
Sorting out and placing all the graphs on one plot page plus labeling all the stuff on the single page will be the challenge.
Thanks DT
Last edited:
DT,
There is something wrong with your impedance measurements from the other thread. Assuming they are taken with swept sine, they should be very smooth. The jaggedness indicates some type of loose connection or you have not programmed the settling parameters correctly into the AP. The adjustable settling parameters are one of the best features in it. They allow one to take good measurements in the shortest time period possible without getting junk data. They are only relevant when the test signal source is a swept or stepped one.
There is something wrong with your impedance measurements from the other thread. Assuming they are taken with swept sine, they should be very smooth. The jaggedness indicates some type of loose connection or you have not programmed the settling parameters correctly into the AP. The adjustable settling parameters are one of the best features in it. They allow one to take good measurements in the shortest time period possible without getting junk data. They are only relevant when the test signal source is a swept or stepped one.
Hello,
Other than the assumption that “there is something wrong” this may be a good discussion. The jagged impedance plots you are speaking of are produced by the APx500 Impedance-Thiele Small application using the APx555 analog frequency generator. The data are collected at a finite number of discrete sampling points. The data can be downloaded in comma separated format or in a spread sheet. There is the option of sampling over a short period of time and over a wide frequency range; the data may stair step or even saw tooth because of the course resolution. Or we may sample over a long period of time with many samples focusing on a narrow frequency range. In this case there will be much better resolution. It is a tradeoff between sample size / time, band width and resolution.
It is my test I get to pick.
There may be something else going on with the DUT. If we were sampling a smooth continuous function I would expect to see stair steps not saw teeth even with course resolution settings.
The plot with jagged edges was a test of a compression driver attached to a waveguide / horn. At the time I said that I was surprised at the multiple large impedance peaks of the CD / waveguide combination. I recall seeing similar impedance peaks and saw teeth in other people’s plots of similar CD / waveguide combinations. I will zoom in and take a higher resolution look at the waveguide.
Last week I took a few days off to go to the redwoods and play in Sparky’s lab. It will be a week or two before we get to go back. Remember this last trip was more about walking on the beach, kicking the tires and getting the machine running.
Thanks DT
DT,
I have 20+ years of experience in using and programming AP sys1 and sys2 hardware. I have never used an APx analyzer, but I have looked over the hardware and it doesn't operate significantly differently than the earlier models, so I'm very sure that the measurement results will be better or the same.
The jaggedness in the impedance measurements that are visible in the other thread can not be in the behavior of the DUT. They must be results of the measurement setup. For the driver to behave the way it does with the raggedness visible would break the laws of physics.
The impedance peaks at 500Hz, 1.7kHz and above 15kHz are of course all characteristics of the horn and the driver combination. Almost all of the other features in the measurement are not real.
I've attached a measurement of a metal cone 6.5" woofer for comparison made with a sys2. Note how it is completely smooth. There is no smoothing in the measurement. I can't open the original data file right now, but this curve probably has 150 data points over the measured bandwidth.
If you are interested, I'd be happy to come by and help figure out what is wrong.
Attachments
Hello,
To repeat one more time; there was no attempt to optimize anything here.
This was a test drive of the APx1701. The graphs and data are unprocessed and raw. Checking the process the data check box in the software would have made things appear much smoother.
Yes the drivers were sitting loose on the bench and what we are seeing is likely noise and resonance due to the driver / waveguide bouncing around a little on the bench.
Now take a look at the PDF attached above. Is the data perfectly smooth and continuous? No. the unprocessed data is maybe 150 points across a 20K measurement bandwidth.
I guarantee that there is an Adobe Acrobat curve-fitting algorithm in there somewhere.
Thanks DT
Curve fitting - Wikipedia
DT,
"Processing" has nothing to do with your measurement results. Something about the test setup is not correct.
I'm measured hundreds of drivers with different AP systems. If the results look like what you have, something is wrong.
The roughness can't be due to the driver bouncing around on the desk. The ratio of masses is far too high for that. The motor plus horn weight is probably 1,000 times the moving mass of the diaphram and voice coil.
If the roughness was due to a resonance, there would be frequencies around which the roughness had a lot of amplitude and then at most other frequencies, there would be no roughness.
The impedance curve which I posted looks exactly the same in the AP test software as it does on the pdf file. It is perfectly smooth in both cases.
I'm really trying to help you here with something that I appear to have orders of magnitude more experience with than you do. I can not understand why you are blowing off my help or experience.
John,
I don't know if you have ever used an Audio Precision test system or not, but the analog detectors in them have programmable settling in them. I know of no other audio test hardware with this capability. It allows one to guarantee good data when measuring acoustic systems, which have varying settling times due to resonance and propagation delay. With the AP software, there is some degree of adjustment required when setting up various acoustic tests.
DT's impedance results look like the settling is set to linear and only one or two samples.
Hello,
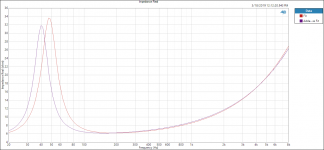
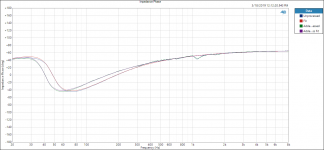
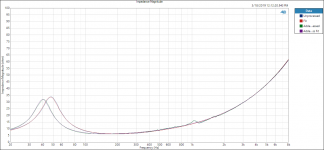
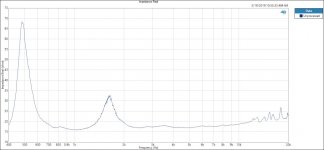
This is the identical setup, one hour different in time, for the JBL2226 woofer. Appears as it should.
The only difference is the DUT, no other changes were made. Except BW.
Thanks DT
This is the identical setup, one hour different in time, for the JBL2226 woofer. Appears as it should.
The only difference is the DUT, no other changes were made. Except BW.
Thanks DT
Attachments

DT,
"Processing" has nothing to do with your measurement results. Something about the test setup is not correct.
I'm measured hundreds of drivers with different AP systems. If the results look like what you have, something is wrong.
The roughness can't be due to the driver bouncing around on the desk. The ratio of masses is far too high for that. The motor plus horn weight is probably 1,000 times the moving mass of the diaphragm and voice coil.
If the roughness was due to a resonance, there would be frequencies around which the roughness had a lot of amplitude and then at most other frequencies, there would be no roughness.
The impedance curve which I posted looks exactly the same in the AP test software as it does on the pdf file. It is perfectly smooth in both cases.
I'm really trying to help you here with something that I appear to have orders of magnitude more experience with than you do. I can not understand why you are blowing off my help or experience.
Hello Jack.
A little about me and what I am about. Relationships over the years are always more important than the technology. We are all smart and will eventually sort out the tech. For as many years as you have been speaking of I have been teaching building trades and mentoring young engineers. Some of these people are returning veterans, paroled murders and even Cal Poly Mechanical engineering graduates. I can guarantee you that none of them continue to listen when you tell them how wrong that they are. Please include me in that group.
Over the years I have always had two jobs.
The day job is for a large, 70 plus person, mechanical engineering office my job is to manage Hospital, medical research and teaching lab projects. Many or most of these projects have variable speed pumps, fans and things. If these systems operate smoothly on the design curve they would not call me. Sound and vibration control is a big thing. I do not spend my time programming an AP analyzer. I do sort out things like fan surge. Check out Google. The entire building can shake so hard the ceiling tiles will fall out just an example. The fan curve is completely discontinuous with fan surge. Variable speed compressors have a wide range of vibrations that shake the building.
The evening job is teaching journey level building trades technicians. We have a building / lab full of mechanical equipment. We move steam, water, air, pumps and fans to teach balance and energy code compliance. Then I go in and change all the settings. Things start to shake and vibrate and make strange sounds. It is the student’s job to sort it all out.
In terms of smooth driver impedance curves, that is not where I want to start. I want to see it all and the lab is where I want to do it. If it wrong that is where I want to start. I know that this approach drives some people nuts, especially if I do not look I am listening.
Now back to smooth continuous impedance curves. If that is where we start, by me something is wrong. It is fairly straight forward getting smooth impedance curves testing cone type woofers. It is the bi-radial horn / waveguide and compression drivers that have additional impedance peaks, dips and smaller ripples that you take exception to. Horns are notorious for having lumpy bumpy impedance plots. We agree that the bigger lumps and bumps are horn and driver related. I have a sneaking suspicion that the jagged smaller ripples may be due to the longer path from throat to mouth of many smaller reflections. The smaller reflections are what Dr. Earl Geddes preaches about.
The plan is to run plots on a couple more cone drivers to verify the test procedures (per AP instructions) and smooth results. Then test 3 or 4 different bi-radial horns and compression drivers.
It is not the intent to blow you off and make you angry. You just started off on the wrong foot.
Thanks DT
- Home
- Loudspeakers
- Multi-Way
- Measuring speaker stuff starting with Thiele-Small parameters