You seem to think those are the normal appearance of impedance curves, but they are not. Your measurements are contaminated by noise. There are a number of possible causes, including incorrect setup of the equipment and background acoustic noise (drive units act as microphones). If the raw data is contaminated then smoothing it is just lipstick on a pig, it would be better to fix the problem so that the later measurements are meaningful.
You seem to think those are the normal appearance of impedance curves, but they are not. Your measurements are contaminated by noise. There are a number of possible causes, including incorrect setup of the equipment and background acoustic noise (drive units act as microphones). If the raw data is contaminated then smoothing it is just lipstick on a pig, it would be better to fix the problem so that the later measurements are meaningful.
As an aside, impedance measurements are not usually smoothed. Smoothing would alter the peak height and obscure resonances.
Thank you,
Now we are talking and I do not feel like someone is telling me I don’t know my butt from a hot rock.
I have the impression that smooth is the exception and not the rule. Noise is everywhere, it is in our test instruments, it is in the Device Under Test and it my originate from less than ideal test condition.
Use Jacks example of the metal cone woofer, there are 150 data points stored in the project data set in a file saved on the computer that the AP Analyzer is attached to. That is the raw data, 150 data points. Download that data in a comma separated file format into an Excel spread sheet and plot the data points on a graph. That is still the raw data. Now plot a graph with 149 short line segments filling in the gaps between the dots. The rest is lipstick and Botox, the pig begins to look good enough to kiss.
The plots that I prefer show the raw data points and the best fit curve on the same page.
The cone woofers are not too difficult to get smooth looking curves. Take a dozen separate tests and plot the smooth looking curves on the same graph page and none of those perfect looking plots will fit onto another. Averaging and smoothing are often used to cover the warts.
Back to Sparky’s test bench with the compression drivers and horn / waveguides. These DUT’s do not produce curves that are nearly so smooth. Large impedance peaks large reflections, little ripples little reflections, I do not know. It will be fun getting it sorted.
I made large effort selecting solid state drives, PWM speed controlled fans and a damped case to put together a Coffee Lake computer to run this APx555 analyzer. I cannot hear the computer running in a quiet room. With the analyzer attached and running it is a different story. I do not know if fan noise is getting into the results. The dominant fan frequency noise is equal to fan RPM X the number of fan blades / 60.
Thanks DT
You are making statements that are simply incorrect.


You may wish to learn a little more about the measurements you are making rather than treating your incorrect assumptions and assertions as fact.
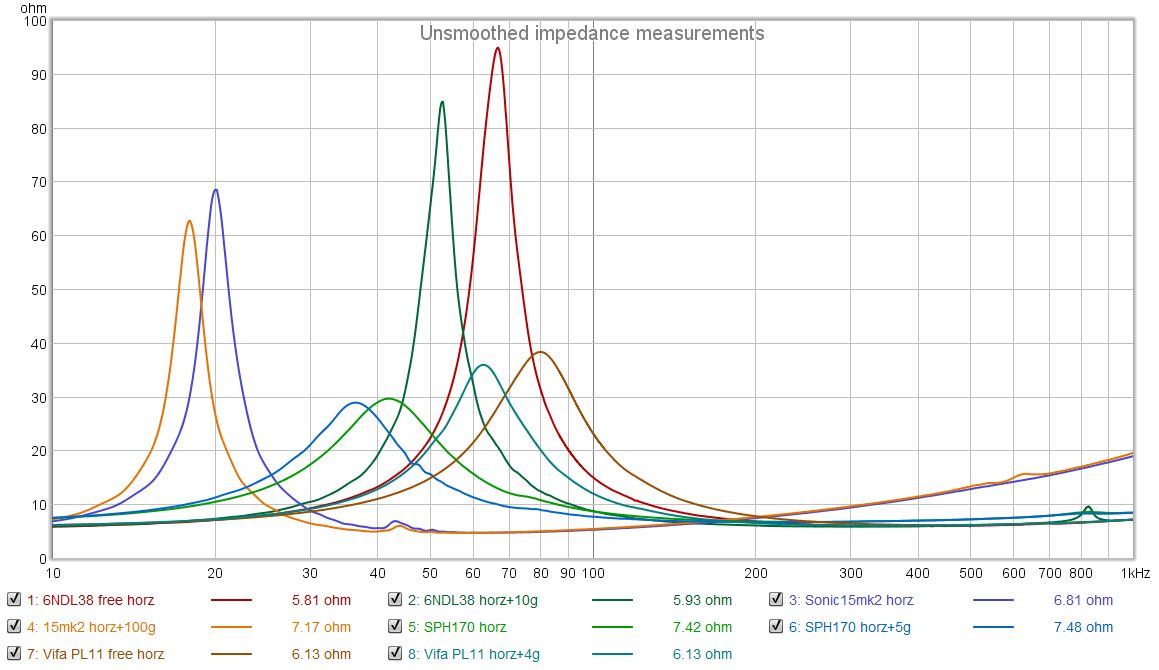
It is not. Here are some swept sine measurements of a variety of drivers with and without added mass. The frequency resolution is 0.366 Hz, so there are about 2,700 points for each measurement in the span shown. This is raw measurement data.I have the impression that smooth is the exception and not the rule.
They will with a proper measurement setup. I don't keep many repeat measurements since they are near identical, but I found a couple. Again, raw measurement data.Take a dozen separate tests and plot the smooth looking curves on the same graph page and none of those perfect looking plots will fit onto another.
No, they are not.Averaging and smoothing are often used to cover the warts.
You may wish to learn a little more about the measurements you are making rather than treating your incorrect assumptions and assertions as fact.
What John is saying is true. These are representitive curve:
There are few bumps and they are the results of resonances in the driver. If in a box they will also show where box resonances are.
dave
What john is saying is completely missing the point.
The plot you are saying is representative is new to the discussion. It has thousands of data points. The cone woofer plot that is the example plot for this discussion has only 150 data points according to Jack who posted it.
At this point these cone woofer plots are a distraction.
I started this with impedance plots and Thiele Small Parameters done on my bench top of a JBL 2226HPL. The impedance plots are as smooth as any see post #23. Longer sampling duration will add more data points. The old time vs. quality discussion.
What got people excited was an impedance plot for a compression driver attached to a horn / waveguide. It was not nearly so smooth. see post #39.
Posting smooth cone woofer impedance plots does not help the discussion of Compression Driver / horn impedance peaks, dips and ripples.
Thanks DT
Is the table of TS parameters in #23 an AP calculation by some magic unknown process?I started this with impedance plots and Thiele Small Parameters done on my bench top of a JBL 2226HPL. The impedance plots are as smooth as any see post #23.
We'll have to trust AP if that is the case. If you are deriving the TS stuff the old fashioned way by inspection of the Impedance curves, then you definitely need more points rather than 'smoothing'.
An 'accurate' impedance curve tells you many things. eg your attachment of the added weight has introduced some Mechanical Damping cos the peak is lower. The cone has probably dropped significantly cos the Inductance at HF has changed.
The problem with TS stuff is that they hide important stuff. The 2 MOST IMPORTANT parameters are Bl & Sd as they appear squared in the relevant eqns. Using impedance curves dreams them up from measurements of dubious accuracy.
I prefer to measure Bl directly using a travelling microscope, added weight & current source.
Those versed in the art have agonised over Sd for decades but there probably isn't a better method than measuring the diameter from half the roll surround.
If the surround isn't a simple roll, things get hairy and we retreat to saying it isn't important for these cheapo units anyway

Another important factor that TS hides is Mms. If you do measurements at different voltages, check that you are getting the 'same' Mms.
Last edited:
These impedance peaks & ripples are real. They correspond to resonances, both mechanical as well as acoustic resonances in the horns. You will see a set of resonances when the horn 'unloads' ie stops providing horn loading. Look up Jurassic articles on horn design. Also resonances due to reflections etc.Back to Sparky’s test bench with the compression drivers and horn / waveguides. These DUT’s do not produce curves that are nearly so smooth. Large impedance peaks large reflections, little ripples little reflections, I do not know. It will be fun getting it sorted.
They appear bigger cos the 'efficiency' of the horn loaded units is greater than the bass units.
For good bass units, usually the only one visible is the surround resonance.
You see these at 43, 620, 830 Hz on John's measurements.
Last edited:
DT,
I never said, nor implied that you don't know your butt from a hot rock. I did say "I'm really trying to help you here with something that I appear to have orders of magnitude more experience with than you do." I am not trying to put you down, say you are dumb or anything of the sort. I am just pointing out that I have many years of experience in the very type of measurements that you are performing. By your own admission, you are just learning this. I spent six years in Engineering school at Cal Poly studying this very subject.
I'm a very straight forward person. If I think I need to say something, I will. I won't hide it and expect someone to read between the lines.
This forum is essentially completely unmoderated in the sense that anyone is free to post anything they want. As a result there are amateurs posting correct information, professional (meaning they do this to get paid) who post stuff which is borderline nonsense and everything in between. It is very difficult telling the difference between the two in may cases.
On the subject of smoothing. Whenever smoothing is used, information is thrown away. From that standpoint alone, it is bad practice. There are normally only two reasons to use it. Either there is noise getting into the measurement or there are reflections which can't be avoided. There are several ways to deal with noise to remove it from the measurement. The drive level can be increased. Synchronous temporal averaging can be used (Which the AP can do). When taking frequency response measurements, if you want low frequencies you need to use a longer window length and then use some form of smoothing to average out the reflections. You can use other measurement techniques to get accurate low frequency data without smoothing, but the vast majority of people on this site don't know how to do this, so they smooth everything, hiding all kinds of stuff.
The woofer impedance curves that have been measured in this thread are very smooth. This is for a couple of reasons. Primarily the system that is being measured don't have very many resonances in it. Any resonance in the system creates a resistance at some frequency, so there is then an additional peak at some frequency where the resonance occurs. Secondarily, the efficiency of the woofers is low (1% or so). This means that they function as poor microphones. If there is some acoustic resistance in front of them, this will not be reflected back through the electromagnetic motor back to the electrical impedance side of things very well. The compression driver with a horn has an efficiency which is about 10 times greater. Because of this, any change in acoustic impedance in front of the driver will be reflected back to the electrical side more strongly. That is why there is a 1.5kHz peak visible in at least one of your impedance measurements.
The large peaks at the frequencies I've previously noted, as well as the diaphragm break up modes above 7kHx and 15kHz are real. By real I mean that the properly functioning driver plus horn combination actually has these resistances to motion at these frequencies. All of the other stuff that looks like noise is garbage. It is some form of noise in the environment (really unlikely), bad leads in the test setup or some other problem. It could be that both drivers have a VC rub, but I really doubt this.
If the noise like aspects in these measurements are reflections, then they are going to have a periodicity to them, which they do not have. In addition, they will not be random. I would resweep the same driver combination without touching anything several times in a row. All of the curves should overlay each other. If they don't, then it is impossible for these to be caused by reflections.
Jack and All,
Thanks for the straight up reply.
Yesterday with a yellow highlighter in hand I reread the white paper that you posted; “Consistent Measurement of TS Parameters”, by Mark McClintock.
What I get out of this is that there will not be a single true TS/P result. If a consistent repeatable procedure is followed a tight grouping of results is attainable. A tight grouping of results on the target may be something within 2% or 3%. If you want a single result perhaps an average of several results will be representative, not to say that averaged result would be dead center of the accuracy target. I am thinking of things like Standard Deviation, Standard Error of Measurement and close enough to call it good.
Now to my DIY project:
What I plan to do is open a project in the AP Impedance, Thiele Small software and program in a driver warm up, cool down, run a few sample sweeps to let things settle and then average over the next 3 or 4 sweeps. I hope that is close enough to call it good. The plan is to save the warm up and cool down procedure to reuse it with the next driver test.
There are JBL 2235’s, 2204’s, 2226, and 2206 auditioning for the part of woofer in my home brew monitor.
I will post the results here.
Thanks DT
That's cos TS/P vary with temperature, history, phase of the moon bla bla.What I get out of this is that there will not be a single true TS/P result.
But the IMPORTANT parameters don't change. If your several TS/P measurements come up with the same Mms, they are probably OK. If not, they are wonky, perhaps seriously wonky.
I don't think any of the common TS/P methods is good enough to get reliable Bl. You should measure this directly.
Try simulating a unit for a B4 alignment and then vary Fa by up to 2x either way while twiddling the other TS/Ps to keep Mms & Bl the same. Your simulated response will change only a little.
Hello,
Let’s take the logical leap and assume that we can get TS/P as good as Thiele and Small did in the old days with French curves and slide rules.
Now we have good TS/P numbers how good are they at calculating box sizes and tuning frequencies? Good enough or should we retest a prototype at expected listening large signal output sound pressure levels?
How far off do expect that we will be?
Thanks DT
The T/S if good will get you close if you know what you are doing with the modeler you are using. Some test boxes are often needed — i have burned more than a few protos.
But T/S change with with how high you turn the wick, temperature, dynamics of the music, air pressure. Some tolerance to those are needed in the design, either thru brute-force (a good horn) or subtlety (hundreds of builds of my miniOnken alignments have shown it works, so we are ususally good right off the 1st design sheet).
dave
one off set of woofers
Hello Dave,
Thank you for sharing your experience with us.
I think that I am getting the vibe.
If you use a quality name brand driver you can expect uniform results. If you use that same driver in an enclosure that you built just like the last one there should be consistent results as well.
I have a pair of reconed JBL Woofers here with 2232 cones, weights and voice coils from 2245 18 inch subs (so I was told when I bought them). Kind of a one off set of woofers.
The plan is to use the Audio Precision instruments to measure the TS / P. Then call it good and use the test results to fabricate a prototype reflex enclosure.
Thanks DT
The T/S if good will get you close if you know what you are doing with the modeler you are using. Some test boxes are often needed — i have burned more than a few protos.
But T/S change with with how high you turn the wick, temperature, dynamics of the music, air pressure. Some tolerance to those are needed in the design, either thru brute-force (a good horn) or subtlety (hundreds of builds of my miniOnken alignments have shown it works, so we are ususally good right off the 1st design sheet).
dave
Hello Dave,
Thank you for sharing your experience with us.
I think that I am getting the vibe.
If you use a quality name brand driver you can expect uniform results. If you use that same driver in an enclosure that you built just like the last one there should be consistent results as well.
I have a pair of reconed JBL Woofers here with 2232 cones, weights and voice coils from 2245 18 inch subs (so I was told when I bought them). Kind of a one off set of woofers.
The plan is to use the Audio Precision instruments to measure the TS / P. Then call it good and use the test results to fabricate a prototype reflex enclosure.
Thanks DT
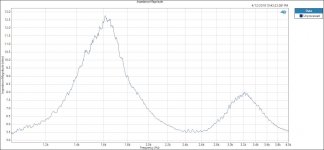
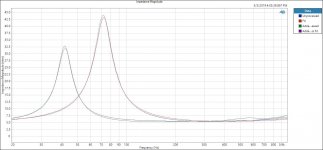
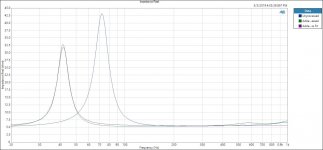
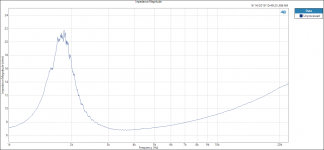
impedance graph of the JBL D2 / JBL PT 1010HF-1 waveguide combination
Hello All,
If you recall a month ago I did some testing / plots of Compression Drivers / Waveguide combinations. I have returned to Sparky’s Lab and completed additional follow up impedance plots. Attached is one sample set of plots for the D2 CD used in the JBL M2 monitor the waveguide is the PT HF1010HF-1. There are more plots to post when I return home.
If you recall I posted impedance plots that included the large mechanical CD impedance peak below 600 Hz and near equally large peak at 1.6K ish. There were small ripple like peaks distributed along the impedance plot. There were comments that he ripples were not likely periodic and not caused by the DC / Waveguide assembly. It was commented that the ripples were likely caused by noise from bad connections or something similar.
I took a closer look and repeated the impedance plots many times. The ripples appear to be very much periodic. I plotted the impedance plots one on top of the other many times. The plots appear to be a single line plot with each plot exactly matching the others, ripple for ripple.
See the attached plots for the D2 CD and PT 1010HF-1 waveguide.
1 A single plot zoomed in to show 1K to 4KHz.
2 A second single plot zoomed in to show 1K to 4KHz.
3 A full Band width plot 630 to 25Khz. To show the complete impedance graph of the JBL D2 / JBL PT 1010HF-1 waveguide combination.
Thanks DT
Attachments

Last edited:
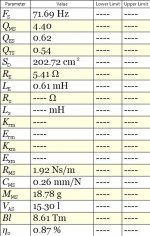
Hello,
Back in the lab for a couple of days.
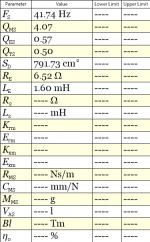
I opened the Lab Log book and set up the analyzer the same as the last time. Today the windows are open a little and things are several degrees warmer. What a difference it makes with thing / parts a little warmer.. The T S / P are closer to the factory numbers.
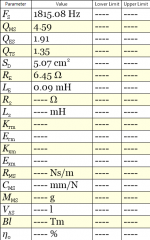
Take a look at the attached JBL 2118H impedance plots and T S P test results for a used Ebay driver.
Found that the modeling clay sticks to the speaker cone if you use a smaller amount (smaller weight)
Thanks DT
Back in the lab for a couple of days.
I opened the Lab Log book and set up the analyzer the same as the last time. Today the windows are open a little and things are several degrees warmer. What a difference it makes with thing / parts a little warmer.. The T S / P are closer to the factory numbers.
Take a look at the attached JBL 2118H impedance plots and T S P test results for a used Ebay driver.
Found that the modeling clay sticks to the speaker cone if you use a smaller amount (smaller weight)
Thanks DT
Attachments
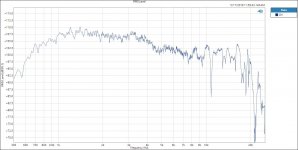
Hello All,
I have been looking at Sean Olive’s Audio Musings at
Audio Musings by Sean Olive: Search results for geddes .
It appears to be a forming consensus that it is not so much nonlinear distortions (THD and IM type distortions) that are audible and irritating to the listener. It is more linear distortions; as in lumpy bumpy frequency response, think peaks and dips or otherwise missing or peaked frequencies, crossover and other non-time or phase aligned discontinuities, reflections and resonances that are the prevalent irritating linear distortions in the speaker response.
Starting with the older waveguides, I have been looking at previous posts regarding Constant Dispersion Compression Drivers and Waveguide combinations plus doing some of my own measurements and plots. It is my impression that the unequalized lumpy bumpy frequency response of the JBL 4344A and JBL 2425H CD has the “classic horn” sound. The mouth, throat and length geometry of the waveguide ensures a peaky resonate horn signature. Equalized with a Klark Teknik DN370 30 band equalizer the JBL 4344A / JBL 2425H CD sounds pretty nice to me.
Take a look at Earl K ‘s post including impedance and Frequency response plots. Note the saw tooth pattern in the included impedance plot. Note the resonance peaks and valleys in the Frequency Response Plot.
Experience with PT Wave Guides
I neglected to save the impedance plot on the USB drive and bring it home with me to post it here.
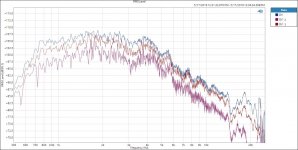
See the Frequency Response of the JBL 4344A and JBL 2425H CD from Sparky’s Lab; on Horizontal axis, 22.5 degrees off axis and 45 degrees off axis. (no smoothing , Raw)
Thanks DT
I have been looking at Sean Olive’s Audio Musings at
Audio Musings by Sean Olive: Search results for geddes .
It appears to be a forming consensus that it is not so much nonlinear distortions (THD and IM type distortions) that are audible and irritating to the listener. It is more linear distortions; as in lumpy bumpy frequency response, think peaks and dips or otherwise missing or peaked frequencies, crossover and other non-time or phase aligned discontinuities, reflections and resonances that are the prevalent irritating linear distortions in the speaker response.
Starting with the older waveguides, I have been looking at previous posts regarding Constant Dispersion Compression Drivers and Waveguide combinations plus doing some of my own measurements and plots. It is my impression that the unequalized lumpy bumpy frequency response of the JBL 4344A and JBL 2425H CD has the “classic horn” sound. The mouth, throat and length geometry of the waveguide ensures a peaky resonate horn signature. Equalized with a Klark Teknik DN370 30 band equalizer the JBL 4344A / JBL 2425H CD sounds pretty nice to me.
Take a look at Earl K ‘s post including impedance and Frequency response plots. Note the saw tooth pattern in the included impedance plot. Note the resonance peaks and valleys in the Frequency Response Plot.
Experience with PT Wave Guides
I neglected to save the impedance plot on the USB drive and bring it home with me to post it here.
See the Frequency Response of the JBL 4344A and JBL 2425H CD from Sparky’s Lab; on Horizontal axis, 22.5 degrees off axis and 45 degrees off axis. (no smoothing , Raw)
Thanks DT
Attachments

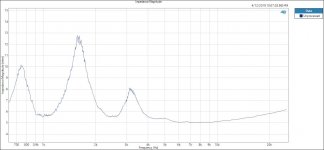
Diaphragm breakup dominates the output quality.
Hello,
For the next one look at the Impedance plot and Frequency Response plots for the JBL PT H1010HF-1 waveguide and JBL 2432H Compression Driver combination.
Looks to me that diaphragm breakup dominates the output quality for the JBL PT H1010HF-1 waveguide and JBL 2432H Compression Driver combination.
Not so good.
Thanks DT
Attachments
Last edited:
Anyone have any luck downloading the FREE AES papers (courtesy Harman) mentioned by Olive in his blog?I have been looking at Sean Olive’s Audio Musings at
Audio Musings by Sean Olive: Search results for geddes .
Audio Musings by Sean Olive: Part 3 - Relationship between Loudspeaker Measurements and Listener Preferences
I just get directed to AES E-Library >> Loudspeaker Measurements and Their Relationship to Listener Preferences: Part 1 who demand loadsa $$$ which dis beach bum can't afford
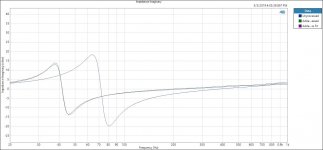
not your glossy sales brochure kind of impedance plot
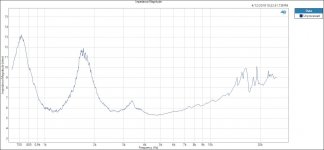
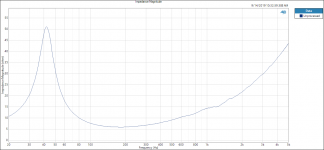
Hello,
This is not your glossy sales brochure kind of impedance plot. This is high resolution with no smoothing.
First up is a JBL2226HPL driver. No lumps or bumps or ragged edges.
Next up is a FatialPro HF111 Compression Driver attached to a STH100 horn. The rough edges that you see on the impedance plot are real. This is typical CD / Horn behavior never shown is a sales brochure.
Someone sent me an PM asking me to post a impedance plot of the FatialPro HF111 Compression Driver STH100 horn. I could not attach a PNG image to a PM so here it is.
Thanks DT
Attachments
- Home
- Loudspeakers
- Multi-Way
- Measuring speaker stuff starting with Thiele-Small parameters