Ok, here's how I see this... D.A.S. and Faital woofers and Volt VM752 mids are all ordered. Once I have them, I will do various measurements (as described in an earlier post). The directivity of the VM752 will tell us how to match the tweeter. If these data still show the same directivity as the aX measurements (I would be surprised if they didn't), we can go ahead an design a suitable waveguide/tweeter combination. Otherwise the Satori tweeter as in Pauls simulation study seems a good choice to me.
What do you guys think?
Good plan to do these measurements. It will help for some more detailed study of all.
Concerning the tweeter, we have to look to more tweeter versions.
Satori has also soft domes, 8 Ohm versions, like Kapelli mentioned in post #182. The Bliesma T34-A or T34-B, interesting also.
I am looking to the Directivity Index (DI) of the Monkey box. I started a tweeter waveguide study using the Leap simulator, I think it is possible to simulate it.
I used the measurements of the Monacor DT300, with and without the Monacor WG300 waveguide, to define a transfer of that waveguide as a function of frequency and of the horizontal on and off axis angle. I have a waveguide transfer now of the WG300 at 0, 15, 30, 45 and 60 degrees horizontal on and off axis.
At first I have simulated the single-half-plane (horizontal) DI of the Monkey Box design with the LR4 X-over and the current driver models, without a waveguide for both.
See these results in the plot of the DI of the Volt VM752 (green color), the Satori TW29BN (red color) and the LR4 filtered sum of all drivers (black color) in the Monkey Box.

The large dips at 1 kHz for the midrange and the 2.5 kHz for the tweeter are not good. Waveguides are needed (the midrange already has).
Remark that these dips are not seen on infinite baffle, they are mainly caused by bafflestep and diffractions.
Look to the DI of midrange and tweeter in cabinet and on infinite baffle in the plot. Infinite baffle curves in light color.

Applying the WG300 waveguide on the tweeter in the cabinet in the following plot. The DI improvement for the tweeter can be seen.

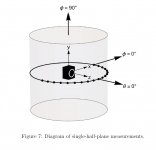
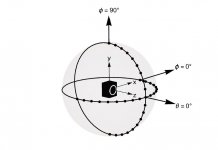
As an information, in attach the diagrams of the single-half-plane measurements and the single-hemisphere measurements, that are used for the DI calculation.
At this time the single-half-plane measurements are used for the DI calculation. Later single-hemisphere measurements can be used to see the impact of the X-over filter on the vertical dispersion also.
Matthias:
If you can provide me later with the off axis measurements of the tweeter with and without waveguide, I use now 15 degrees steps up to 90 degree, that should me very useful. On IEC baffle should be the best.
And also the off axis measurements of the Volt midrange.
With off axis measurements of the drivers only in the cabinet, I can calculate the DI also, but then I cannot make a transfer of the tweeter waveguide, which is very useful in simulation.
I used the measurements of the Monacor DT300, with and without the Monacor WG300 waveguide, to define a transfer of that waveguide as a function of frequency and of the horizontal on and off axis angle. I have a waveguide transfer now of the WG300 at 0, 15, 30, 45 and 60 degrees horizontal on and off axis.
At first I have simulated the single-half-plane (horizontal) DI of the Monkey Box design with the LR4 X-over and the current driver models, without a waveguide for both.
See these results in the plot of the DI of the Volt VM752 (green color), the Satori TW29BN (red color) and the LR4 filtered sum of all drivers (black color) in the Monkey Box.
The large dips at 1 kHz for the midrange and the 2.5 kHz for the tweeter are not good. Waveguides are needed (the midrange already has).
Remark that these dips are not seen on infinite baffle, they are mainly caused by bafflestep and diffractions.
Look to the DI of midrange and tweeter in cabinet and on infinite baffle in the plot. Infinite baffle curves in light color.
Applying the WG300 waveguide on the tweeter in the cabinet in the following plot. The DI improvement for the tweeter can be seen.
As an information, in attach the diagrams of the single-half-plane measurements and the single-hemisphere measurements, that are used for the DI calculation.
At this time the single-half-plane measurements are used for the DI calculation. Later single-hemisphere measurements can be used to see the impact of the X-over filter on the vertical dispersion also.
Matthias:
If you can provide me later with the off axis measurements of the tweeter with and without waveguide, I use now 15 degrees steps up to 90 degree, that should me very useful. On IEC baffle should be the best.
And also the off axis measurements of the Volt midrange.
With off axis measurements of the drivers only in the cabinet, I can calculate the DI also, but then I cannot make a transfer of the tweeter waveguide, which is very useful in simulation.
Attachments
Last edited:
Paul, this is very useful again!
Do the mid simulations also have the waveguide transfer function?
Do the transfer functions account for the setback and the corresponding time delay involved with the waveguide?
In the design with the LR4 filter, no waveguides were used for midrange and tweeter. In that design I took 1 cm backwards position for the acoustical center of the midrange w.r.t. the tweeter. I just did that post to show that a wavequide for the tweeter has some sense. For the tweeter without filter, I added the Monacor waveguide transfer to show the DI difference with and without the waveguide. I have to do some work arounds in Leap for the DI and SPL off axis responses of the final design. If I can create the waveguide transfers, it is possible I suppose.
Edit: once we have the DI responses vs. Freq of the drivers with waveguide, we will have a better view on the X-over crossover point also to realize the most flat DI. First we have to create the waveguide transfers with measured off axis responses of the drivers.
Last edited:
Also interesting is a pre-measurement on IEC baffle. Afterwards it is easier to analyse the impact of waveguide and cabinet diffraction separately.If drivers are locked, I would wait for off-axis measurements in the intended baffle. Interesting to see how LEAP or other sims cope with them. Remember to check distortion too!
THD, very important indeed. I am not well equipped to measure it myself,
On closer inspection, simulating on and off axis responses of a driver with waveguide in a cabinet isn't possible in Leap. Applying some waveguide correction on the simulated diffraction responses on and off axis without the waveguide, isn't the same. The on axis SPL in a cabinet is a sum of direct and reflected data. So the diffraction simulation has to be done with a driver model with waveguide, which cannot be made in Leap. Only with measured on and off axis resposnes the DI can be calculated in Leap. My conclusions in post #202 were made too fast.
Just to make sure I get this right... Modeling a waveguide tweeter on the speaker baffle is possibe once you have measured data of the the waveguide driver on an IEC baffle?Only with measured on and off axis resposnes the DI can be calculated in Leap.
Soooo... Should I do the IEC baffle tests first so you can tweak the Monkey Box baffle in Leap? Or should I build the prototype Monkey Box/baffle straight away as in your earlier simulation study?
No, it is not possible with a waveguide transfer on and off axis, measured before on IEC baffle.
Suppose there is a SPL dip of a tweeter without waveguide in a cabinet. It is the result of the sum of direct and indirect waves. Compensation for this dip with one waveguide transfer at one angle position is not correct, because the dip is caused by all off axis responses, which are different with and without waveguide.
The waveguide transfer has to be built in, in the Leap model, before starting a diffraction simulation. Making such model in Leap is not possible, because Leap is always using its own driver cone model to calculate the off axis responses.
Calculating the DI responses of the drivers with a waveguide in the cabinet is possible in Leap, but only with measured on and off axis responses in the cabinet.
Soooo... Should I do the IEC baffle tests first so you can tweak the Monkey Box baffle in Leap? Or should I build the prototype Monkey Box/baffle straight away as in your earlier simulation study?
Doing IEC baffle measurements before of the midrange, and the tweeter with and without waveguide, are useful of course.
Then we can calculate and compare the DI of the drivers on the IEC baffle.
They should match already. That DI can be calculated in Leap with those measurements.
It is a good test for the tweeter waveguide and you can make a decision to use the waveguide or not. The bafflestep also has its influence on the DI, but that impact is almost the same for both drivers (I think so...)
Tweaking with the position of the drivers with waveguide on the baffle isn't possible to simulate. Maybe starting with the cabinet model and the driver positions of the earlier study, yes.
Again a long story, I did some analysis of the DI of both midrange and tweeter in the Monkey Box, both drivers without waveguide.
At first the comparison the DI of both drivers on infinite baffle and in the Monkey cabinet.
In the plots the most smooth DI is on infinite baffle.
midrange

tweeter

For the midrange the DI in the cabinet is mapping on the infinite baffle DI (= no impact of cabinet) down to 1kHz and below 1 kHz the DI in the cabinet becomes higher due to the bafflestep of the cabinet. Applying a waveguide to it (like with the Volt VM752), probably the irregularity around 1.8 kHz will become better, and the DI will become a little higher above 1kHz. But the bafflestep boost below 1 kHz will not be changed by a waveguide.
For the tweeter the DI in the cabinet is mapping on the infinite baffle DI down to 3kHz. Below 3 kHz the DI in the cabinet has a dip at 2.5 kHz. This dip is related to the tweeter distance from the top of the cabinet, which is now 9 cm. Below 1 kHz the DI becomes higher also due to the bafflestep, just like the midrange. Applying a waveguide to the tweeter, probably the dip around 2.5 kHz will disappear. The bafflestep boost below 1 kHz also will not change. Above 3 kHz the DI will become higher.
By increasing the tweeter distance from top to 15 cm, the DI dip appears at a lower frequency, see in the plot below. Maybe a better match with the midrange can be obtained for a more flat combined DI with X-over.
tweeter 15 cm from top

Looking to the combined DI with LR4 filter at 2500 Hz without waveguides.

Adding a waveguide to the tweeter the dip at 2500Hz will be better. The dip around 1 kHz, I am afraid it will not disappear by a midrange waveguide like implemented in the Volt VM752, we have to check that with measurements on the Volt driver.
Applying the tweeter waveguide will increase the DI above a few kHz and decreasing the global power of the tweeter. I am afraid that maybe that power loss is not so good in combination with a 3 inch midrange. In combination with a larger midrange, it is different, now I have some doubts about the tweeter waveguide. I think we can evaluate that with IEC tests and simulating the global power of the design.
At first the comparison the DI of both drivers on infinite baffle and in the Monkey cabinet.
In the plots the most smooth DI is on infinite baffle.
midrange
tweeter
For the midrange the DI in the cabinet is mapping on the infinite baffle DI (= no impact of cabinet) down to 1kHz and below 1 kHz the DI in the cabinet becomes higher due to the bafflestep of the cabinet. Applying a waveguide to it (like with the Volt VM752), probably the irregularity around 1.8 kHz will become better, and the DI will become a little higher above 1kHz. But the bafflestep boost below 1 kHz will not be changed by a waveguide.
For the tweeter the DI in the cabinet is mapping on the infinite baffle DI down to 3kHz. Below 3 kHz the DI in the cabinet has a dip at 2.5 kHz. This dip is related to the tweeter distance from the top of the cabinet, which is now 9 cm. Below 1 kHz the DI becomes higher also due to the bafflestep, just like the midrange. Applying a waveguide to the tweeter, probably the dip around 2.5 kHz will disappear. The bafflestep boost below 1 kHz also will not change. Above 3 kHz the DI will become higher.
By increasing the tweeter distance from top to 15 cm, the DI dip appears at a lower frequency, see in the plot below. Maybe a better match with the midrange can be obtained for a more flat combined DI with X-over.
tweeter 15 cm from top
Looking to the combined DI with LR4 filter at 2500 Hz without waveguides.
Adding a waveguide to the tweeter the dip at 2500Hz will be better. The dip around 1 kHz, I am afraid it will not disappear by a midrange waveguide like implemented in the Volt VM752, we have to check that with measurements on the Volt driver.
Applying the tweeter waveguide will increase the DI above a few kHz and decreasing the global power of the tweeter. I am afraid that maybe that power loss is not so good in combination with a 3 inch midrange. In combination with a larger midrange, it is different, now I have some doubts about the tweeter waveguide. I think we can evaluate that with IEC tests and simulating the global power of the design.
Paul... This good stuff!
I guess we will have to see what the measurements say. In particular I believe the VM752 starts beaming quite a bit earlier than what Leap predicts for a conventional 3" driver. My goal would be to match the tweeter dispersion to that of the mid at xover, and have smooth dispersion above that.
I guess we will have to see what the measurements say. In particular I believe the VM752 starts beaming quite a bit earlier than what Leap predicts for a conventional 3" driver. My goal would be to match the tweeter dispersion to that of the mid at xover, and have smooth dispersion above that.
... gofoundme campaign. If you want me to move ahead with building a first prototype for testing purposes, please support the campaign here. I you want to be included in the list of sponsors, please state your diyAudio user name in the comments of your donation.
For those of you who are actively participating in the design process or those who are interested in helping with fund raising, please send me a PM with your email address so that I can add you to the "team" of the gofundme campaign.
For those of you who are more into social media than me (i.e., most of you), please share the gofundme campaign so the project gets a bit more exposure in the right places.
Let's see how this goes.
P.S.: I guess I'll get both the Faital and the D.A.S. woofer so that we can compare them better.
Bumping this.
Looking forward to impressions of build quality on the drivers involved, as well as the results from measurements.
Bumping this.
Looking forward to impressions of build quality on the drivers involved, as well as the results from measurements.
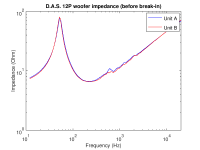
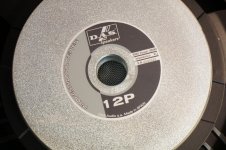
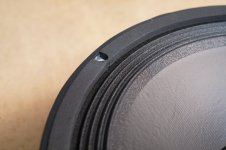
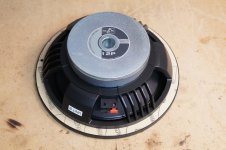
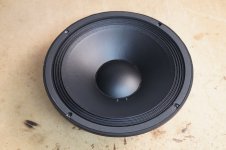
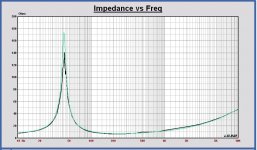
The D.A.S. 12P woofers arrived today. I made a few photos and some first impedance measurements (attached). The build quality of the drivers looks good to me, and the impedance curves match nicely. The woofers are now breaking in (15 Hz sine at 10 Vrms over night). I will take proper impedance measurements after break in.
Attachments
We can already start with TSP check.
If you have the frd's of impedance responses, they are welcome.
The drivers first need some break-in to loosen the suspension parts. After a few hours of 15 Hz sine @ 10 Vrms this night, the resonance frequency decreased a bit from 52 to 48 Hz, and the impedance peak max. increased from 77 to 93 Ohm. This is not yet consistent with the datasheet says (42 Hz, 200 Ohm max.). I'll continue with the break in and see what happens.
The woofers are now breaking in (15 Hz sine at 10 Vrms over night). I will take proper impedance measurements after break in.
After another 24h with 15 Hz at 20 Vrms, the impedance curve does not change anymore. These PA woofers take quite some beating to break in!
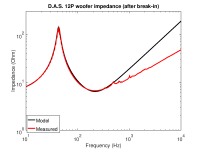
I let the driver cool down from the break-in and then measured the impedance curve. I did a quick and dirty calculation of the Thielle-Small parameters from the impedance peak (black curve in attached plot):
Rdc = 6.3 Ohm
f0 = 42.8
Qes = 0.33
Qms = 7.1
These values are consistent with the manufacturer specs, except Qms is a bit lower. I could not get the Le part of the impedance curve right with my simple model (or maybe I didn't try hard enough).
Impedance data is attached (FRD file, had to add a ".txt" extension for the upload to diyAudio). Paul, can you check my TSP values?
I hope the Faital 12PR320 drivers show up soon, so that we can compare them. BlueAran used DPD for shipping, which means I might never get them...
Attachments
I had to edit the frd, too many samples for Leap. I don't know exactly the limit.
I never take more samples than a few 100 in a frd for Leap import.
It looks very good. If I only change Qms to 8 in the Leap model made with datasheet TSP, your measurement fits perfect on the model.
In the plots your measurement in black, the Leap model made with datasheet TSP values in green, and the adapted Leap model that fits on your measurement in red.
So all TSP of your drivers are conform datasheet except the Qms is a little lower.
Attachments
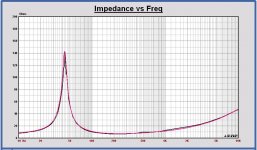
In the plots your measurement in black, the Leap model made with datasheet TSP values in green, and the adapted Leap model that fits on your measurement in red.
That's good to see.
Just out of curiosity, I wonder how LEAP models the impedance rise above the low-frequency peak. Do you know that? Does the manual say how the LEAP model works (formula, circuit model)?
- Home
- Loudspeakers
- Multi-Way
- Open Source Monkey Box