Hi Matthias,
I did some more trials to fit the simulated impedance in the best way on your basreflex impedance measurement. I only get good fitting results if I increase the fs of the driver to 46 Hz. Otherwise the frequency tops are not at the right place.
If possible, can you do the free air impedance measurement again one time.
For me it is interesting to check the accuraccy of my simulation model, also to obtain the correct low frequency SPL.
In attach the current driver model used for simulation.
The driver is mounted in the box, with the rear wall on. I might take the driver out at some later stage and repeat the free-air measurement. However, I am pretty sure your assumption of a higher fs for your model is indeed correct. The impedance measurements of the box were done in my cold workshop, and we have already learned that the fs of the cold driver is quite a bit higher at these low temperatures (up to 48 Hz).
The microphone finally arrived! It's an Earthworks M23, so I guess I don't have to worry about old microphones with fishy specs anymore.
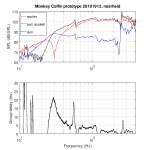
I made a few nearfield measurements of the woofer and the port with my current prototype box (see drawing in post 346, I call it the 20181219 prototype from now on).
The measurements and data processing were as follows:
The results are shown in the attachment. Please ignore the artefacts at about 58 Hz, 120 Hz and 260 Hz (room modes).
Port tuning frequency is 30 Hz, much lower than the 40 Hz I get from modelling the 20181219 prototype box with AJ Horn. Group delay is 7 ms at 40 Hz, and peaks at the port tuning frequency, where the summed SPL curve kinks. I guess I'd like to make the port tuning frequency a bit higher to increase the SPL between 30 to 50 Hz, and to get a smoother kink in the SPL curve (and hence even less group delay).
What do you think?
P.S.: These measurements were done in my cold workshop, so the woofer suspension is a bit stiffer than at normal room temperatures (see earlier posts). To test the effect of this, I repeated the measurements after warming the surround of the woofer with a heat gun. The acoustic results were almost the same, so no reason to worry about this too much.
I made a few nearfield measurements of the woofer and the port with my current prototype box (see drawing in post 346, I call it the 20181219 prototype from now on).
The measurements and data processing were as follows:
- Measure impulse response in the nearfield of the woofer or the port.
- Apply gating time of 1 second to obtain full low-frequency response down to 1 Hz
- Scale the port impulse response by the ratio Sp/Sd, where Sp is the port area and Sd is the effective cone area of the woofer
- Calculate summed response by adding the impulse responses of the woofer and the port (scaled).
- Determine the nearfield SPL response curves of the woofer, port and summed response.
- Apply smoothing (1/6th octave) to the summed response and calculate group delay from this.
The results are shown in the attachment. Please ignore the artefacts at about 58 Hz, 120 Hz and 260 Hz (room modes).
Port tuning frequency is 30 Hz, much lower than the 40 Hz I get from modelling the 20181219 prototype box with AJ Horn. Group delay is 7 ms at 40 Hz, and peaks at the port tuning frequency, where the summed SPL curve kinks. I guess I'd like to make the port tuning frequency a bit higher to increase the SPL between 30 to 50 Hz, and to get a smoother kink in the SPL curve (and hence even less group delay).
What do you think?
P.S.: These measurements were done in my cold workshop, so the woofer suspension is a bit stiffer than at normal room temperatures (see earlier posts). To test the effect of this, I repeated the measurements after warming the surround of the woofer with a heat gun. The acoustic results were almost the same, so no reason to worry about this too much.
Attachments
Matthias,
For sure you have crosstalk between your port and driver measurements.
The SPL fall off of a port is 12dB per octave above the tuning frequency fB.
In your port measurement it is much less because of driver crosstalk.
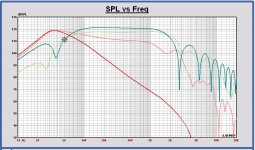
Look in attach to the nearfield responses in Leap.
In dark color are the calculated driver and port responses, standard done by Leap. They are correct.
In light color, if I place the microphone close to port and driver and measure SPL. These measurements in Leap become close to your measurements.
Remark the nearfield driver SPL dip below 30 Hz also, instead of the 38 Hz which is correct.
You cannot measure this in a good way, because of the SPL crosstalk.
For sure you have crosstalk between your port and driver measurements.
The SPL fall off of a port is 12dB per octave above the tuning frequency fB.
In your port measurement it is much less because of driver crosstalk.
Look in attach to the nearfield responses in Leap.
In dark color are the calculated driver and port responses, standard done by Leap. They are correct.
In light color, if I place the microphone close to port and driver and measure SPL. These measurements in Leap become close to your measurements.
Remark the nearfield driver SPL dip below 30 Hz also, instead of the 38 Hz which is correct.
You cannot measure this in a good way, because of the SPL crosstalk.
Attachments
Congrats on the Earthworks M23!
A higher port tuning will not make GD lower on 40hz. Kinks seem related to room modes, except the one at 253hz, where it can be dealt with by fixing issues with internal box layout and dampening.... This was why I suggested having the port further away from the driver, higher tuning will not help.
Have you tried listening to it?
Your measurements seem compareable to the hornresp sim. There is crosstalk for sure, hard to avoid it. Any dampening material yet?
...
Port tuning frequency is 30 Hz, much lower than the 40 Hz I get from modelling the 20181219 prototype box with AJ Horn. Group delay is 7 ms at 40 Hz, and peaks at the port tuning frequency, where the summed SPL curve kinks. I guess I'd like to make the port tuning frequency a bit higher to increase the SPL between 30 to 50 Hz, and to get a smoother kink in the SPL curve (and hence even less group delay).
What do you think? ...
A higher port tuning will not make GD lower on 40hz. Kinks seem related to room modes, except the one at 253hz, where it can be dealt with by fixing issues with internal box layout and dampening.... This was why I suggested having the port further away from the driver, higher tuning will not help.
Have you tried listening to it?
Your measurements seem compareable to the hornresp sim. There is crosstalk for sure, hard to avoid it. Any dampening material yet?
Last edited:
Matthias,
For sure you have crosstalk between your port and driver measurements.
The SPL fall off of a port is 12dB per octave above the tuning frequency fB.
In your port measurement it is much less because of driver crosstalk.
Oh, man, you told me about this already a few days ago, and now I still do this stupid mistake. Oh well.
I tried reducing the crosstalk by sticking the microphone into the port. This helps, but the slope is still less than 12 dB/octave. Also, I can't avoid the crosstalk from the port to the woofer anyway.
I tried the nearfield setup as described in the Klippel application note AN39 (page 2): put the microphone somewhere between the woofer and the port and move it around until you get a suck-out at a very low frequency below the port tuning. That's where the woofer and port output are out of phase by 180°, so the acoustic sum at this position is theoretically what we're looking for. What do you guys think about this method?
A higher port tuning will not make GD lower on 40hz. Kinks seem related to room modes
By "kink" I was referring to the change in the general slope of the summed response curve at about 30 Hz (not the room modes). This kink goes hand in hand with a change in phase response, so the derivative of the phase response (=group delay) goes up at the kink. If the kink gets smoother, the group delay goes lower.
Have you tried listening to it?
Not yet.
Your measurements seem compareable to the hornresp sim.
Can you show your Hornresp setup for the Monkey Coffin? I'd like to have a play with it.
Any dampening material yet?
Not yet.
In my simulation the port is tuned at 37 Hz ... it cannot be measured exactly by the SPL dip neither by the impedance dip, if the port is positioned close to the driver and there is some phase shift caused by the voice coil inductance. You have to measure the excursion dip.
I just did that. The excursion dip is between 34 and 35 Hz. Pretty much consistent with the tuning frequency of 34.5 Hz suggested by the impedance curve in post 346.
The excursion dip is actually pretty easy to measure. Hook up the test amp to a sine generator and mount a little stick or similar very close to the dust cap. Turn up the drive voltage until you hear the dust cap buzzing on the stick, change the frequency until the buzzing stops, and turn up the volume to bring the buzzing back at this lower excursion frequency. Repeat this until you found the frequency of the excursion minimum.
Very good idea Matthias to measure the excursion that way. I think this is the most accurate method to measure the tuning frequency, but it shows that the impedance dip can also be used in this case. The phase shift caused by the voice coil inductance at fB is minimal for this woofer.
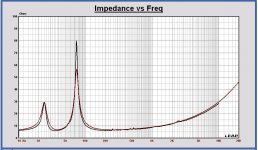
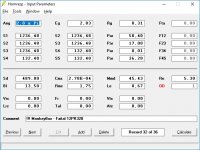
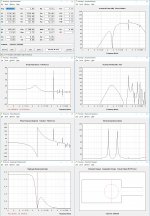
In Leap the minimum impedance value is 38 Hz. It is caused by a different impedance shape of the port peak. In the plot the black curve is the measurement. For some reason I don't understand, the Q factor of the measured port is higher than the model in Leap.
I think the fit is accurate enough to make a low frequency SPL curve.
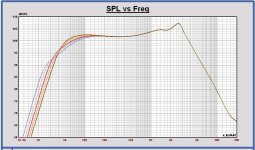
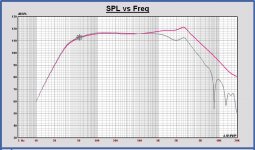
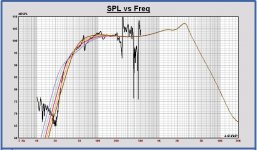
I also looked to the SPL for different tuning frequencies.
For the red curve, fB = 38 Hz. The other tuning frequencies are 30, 34, 42 and 46 Hz.
fB = 46 Hz is very close to a B4 basreflex alignment.
The red SPL curve matches the best with the current (measured) impedance response.
Edit: the SPL curves are infinite baffle responses, woofer placed in basreflex.
In Leap the minimum impedance value is 38 Hz. It is caused by a different impedance shape of the port peak. In the plot the black curve is the measurement. For some reason I don't understand, the Q factor of the measured port is higher than the model in Leap.
I think the fit is accurate enough to make a low frequency SPL curve.
I also looked to the SPL for different tuning frequencies.
For the red curve, fB = 38 Hz. The other tuning frequencies are 30, 34, 42 and 46 Hz.
fB = 46 Hz is very close to a B4 basreflex alignment.
The red SPL curve matches the best with the current (measured) impedance response.
Edit: the SPL curves are infinite baffle responses, woofer placed in basreflex.
Attachments
Last edited:
put the microphone somewhere between the woofer and the port and move it around until you get a suck-out at a very low frequency below the port tuning. That's where the woofer and port output are out of phase by 180°, so the acoustic sum at this position is theoretically what we're looking for.
I think this will give the correct nearfield sum, I will check it.
...
By "kink" I was referring to the change in the general slope of the summed response curve at about 30 Hz (not the room modes). This kink goes hand in hand with a change in phase response, so the derivative of the phase response (=group delay) goes up at the kink. If the kink gets smoother, the group delay goes lower.
...
Short answer: No.
Shift the tuning frequency higher up in frequency you get a potential for harder phase wrap, and the GD peak is DIRECTLY related to port resonance in combination with box dimensions and volume:
shift tuning frequency higher = shift GD peak higher in frequency
Did you use the calibration file for the mic? Or is it something with the db scale on your measurement? Set them to 5db/div if possible please. It seems the response drops faster than (all) the sims.
... And the sim that looks to be the closest is with a smaller port (132 mm2), but even that does not drop so fast... Could it be temperature related? Cold air is denser, no?
Attachments
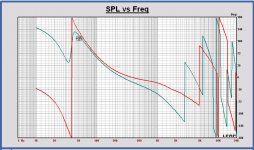
For some understanding, in attach the phase of the port and driver nearfield SPL response, driver in green.
To measure the nearfield sum, you have to move the microphone until the SPL dip below the tuning frequency disappears at very low frequencies. Futher moving in the port direction, the SPL will increase at very low frequencies. But you have to stop already moving at the point where the SPL is minimum at very low frequencies, for example at 10 Hz in this case. That is the point to measure the sum and this SPL is equal to the scaled infinite baffle response up to a few hundred Hz.
I did it in Leap. In the plot you see the nearfield sum vs. the scaled farfield sum in Leap, nearfield in grey.
Maybe give it a trial, it should be very nice if this should work in practice.
Attachments
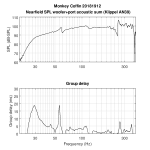
To measure the nearfield sum, you have to move the microphone until the SPL dip below the tuning frequency disappears at very low frequencies. Futher moving in the port direction, the SPL will increase at very low frequencies. But you have to stop already moving at the point where the SPL is minimum at very low frequencies, for example at 10 Hz in this case. That is the point to measure the sum and this SPL is equal to the scaled infinite baffle response up to a few hundred Hz.
That's exactly how I understand the Klippel AN39 note, and that's how I did the measurement. Results are attached (plot and data file). Again, ignore the artefacts caused by room modes.
Very good idea Matthias to measure the excursion that way. I think this is the most accurate method to measure the tuning frequency ... In Leap the minimum impedance value is 38 Hz ... I also looked to the SPL for different tuning frequencies.
For the red curve, fB = 38 Hz. The other tuning frequencies are 30, 34, 42 and 46 Hz.
Looking at your plots, I believe the 34 Hz model is closest to my nearfield measurement following the Klippel AN39 method. But maybe you can load my measured data into Leap for a better comparison.
Attachments
Shift the tuning frequency higher up in frequency you get a potential for harder phase wrap, and the GD peak is DIRECTLY related to port resonance in combination with box dimensions and volume:
shift tuning frequency higher = shift GD peak higher in frequency
I played around with Hornresp. Yes, the GD peak shifts to higher frequencies if a higher tuning frequency is used. But the peak is not as high in my case. It really depends on how sharp the kink is.
Did you use the calibration file for the mic?
Yes. But that does not do much since the mic is perfectly flat down to 10 Hz.
It seems the response drops faster than (all) the sims.
Forget about my earlier attempt at summing the woofer and port nearfield responses. The crossover between the two measurements just screws up everything. I hope the Klippel method gives more useful results.
Looking in the plot you can see the best fit is on the 38 Hz tuning (red), that is the one which matches the best with the measured impedance.
I see a SPL dip at 20 Hz in the nearfield measurement, microphone a very very little bit lower.
I find this an excellent comparison result! And a good method to measure low frequency response and check with simulation.
Edit: Based on these results, I think I can use the low frequency Leap simulation for final SPL curves.
I see a SPL dip at 20 Hz in the nearfield measurement, microphone a very very little bit lower
.I find this an excellent comparison result! And a good method to measure low frequency response and check with simulation.
Edit: Based on these results, I think I can use the low frequency Leap simulation for final SPL curves.
Attachments
Last edited:
I find this an excellent comparison result! And a good method to measure low frequency response and check with simulation.
Edit: Based on these results, I think I can use the low frequency Leap simulation for final SPL curves.
I agree. While I first thought the tunining is at 30 Hz, it really is somewhere in the 35-38 Hz range. That's quite close to what we aimed for in the beginning. Should I even care to try other tuning options?
Next step would be to start working on the x-over (woofer/midrange; tweeter+waveguide might still see some changes). What kind of data would be needed for that? I guess impedance curves of the drivers in the box (I already have those), and acoustic far field measurements (on axis, off axis) would be useful. What else?
...
Yes. But that does not do much since the mic is perfectly flat down to 10 Hz.
...
I was not doubting the mic, it was the SPL curves (but the scaling between programs is a bit different, so it might be nothing).
Here you see what I get from the sim if I enter the exact numbers of your prototype, with 162 mm2 port.
Edit:
Tuning freq is mid 30hz range, it is just that the port output the way its built will be useful a bit lower than usual. IE below acoustic impedance peak.
I would not change a thing. If you went for lower tuning you'd need a different driver also.
Attachments
Last edited:
Yes, for the X-over design the impedance measurements can be used and on axis measurements of all drivers 1m on axis are needed.
For the on axis SPL, I think the best is to measure each driver on its own axis at the 1m distance from the front baffle. It is the most accurate way to obtain a correct response at listening distance.
For the final SPL curves we can use as much measurement info as possible and splice it with low frequency simulated SPL data, especially for woofer and probably also the dome midrange.
We also need an estimation of the woofer acoustical center. Maybe it is possible to measure it also.
For off axis investigation you can do off axis measurements as much as you want. Maybe use 15 degrees steps and not 10 degree. For me in Leap it is too much work to simulate in 10 degree steps.
If you are able to measure up to 90 degrees horizontal and vertical, it is possible to calculate the directivity Index (DI) in a single hemisphere. Some measurements in the single horizontal plane up to 60 degrees for example, are also indicative for the DI.
You can have a look also in the measurement plan I made for the Tower XL.
Concerning the tuning frequency, I also have the idea that it is ok now. If you will make the port shorter you will loose the curve behavior at the end of the port and it will become much shorter. Like you and Kaffimann already discussed before. I will look closer to it later and compare also the Leap results with the AJHorn simulations.
Kaffimann:
Any idea why the port model in Leap has a lower Q factor? The port peak is always wider in Leap. I try to understand it.
Attachments
Last edited:
Paul, I think it is not accurate enough. It seems to me the roll off both above and below resonance is a bit too slow. Bass reflex solutions are typically only effective exactly at resonance (no wonder they get a poor reputation when being done "quick and dirty"), in Leap it seems the sound output should be audible very far up if you could completely isolate measurements of driver and port, not very realistic. Also it seems the internal resonances are off, maybe it does not take the distances to internal boundaries into account.
But I have no clue, just assuming.
But I have no clue, just assuming.
I am actually surprised how well the models are able to reflect the real-world measurements. I guess I'll leave the bass-reflex tuning as it is now.
In the meantime, I have started a webpage to keep the relevant data in an organized way. Or at least I'll try. I would have preferred to do a Wiki here on diyAudio, but it seems the Wiki is not working for a while. The webpage is here.
In the meantime, I have started a webpage to keep the relevant data in an organized way. Or at least I'll try. I would have preferred to do a Wiki here on diyAudio, but it seems the Wiki is not working for a while. The webpage is here.
Paul, I think it is not accurate enough. It seems to me the roll off both above and below resonance is a bit too slow. Bass reflex solutions are typically only effective exactly at resonance (no wonder they get a poor reputation when being done "quick and dirty"), in Leap it seems the sound output should be audible very far up if you could completely isolate measurements of driver and port, not very realistic. Also it seems the internal resonances are off, maybe it does not take the distances to internal boundaries into account.
But I have no clue, just assuming.
But a good tip, I can switch on port non-linearities and resonances and internal cabinet resonances, and try that out also.
To be clear, Leap does simulate the sum response of port and driver at each microphone position that you want. In a way the nearfield sum response can be simulated as described in Klippel AN19. And besides that the nearfield driver and port SPL responses are calculated separately, independent of each other without crosstalk.
As you can see the reconstructed SPL out of Matthias' impedance measurement is already very close to what we expected.
- Home
- Loudspeakers
- Multi-Way
- Open Source Monkey Box