After 24h break in for the Volt VM752 mids I took some impedance curves. Results are attached, very similar for both drivers. My TSP parameters I get from the impedance curve(s): f0 = 386 Hz / Qes = 0.75 / Qms = 10.7 / Re = 6.9 Ohm (from DVM).
The factory datasheet values are f0 = 400 Hz / Qes = 0.81 / Qms = 9.53 / Re = 6.3 Ohm
Using my TSP and the datasheet Vas value, I get an efficiency of 93.5 dB/1m/2.83 V. With the factory data, I get 94.1 dB/1m/2.83V.
Paul: can you use the impedance curves / TSP for a revised model of the Volt?
Everyone: Let me know what you think.
Attachments
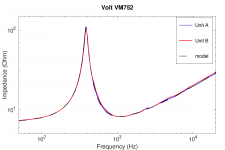
Very similar results for the two drivers, excellent.
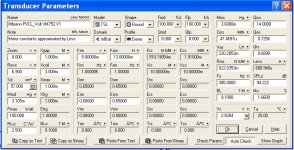
See the Leap model in attach, if I do a perfect impedance map on your measurement.
W.r.t. to the datasheet, I had to decrease BL and fs a little, and increase Qms.
Sensitivity at 1W, 1m is 94.22dB vs. 94.8 dB in the datasheet.
Maximum sensitivity at 2.83 Vrms, 1m is 95.45 dB vs 96.05 dB in the data sheet.
Very good results, I will use this model now for further design.
Attachments
Just a quick heads up... My measurement microphone seems a bit fishy. When I stuck it in my level calibrator, the sensitivity of the microphone was way off from what it used to be a while ago. So I dug out my other, older microphone and stuck that into the level calibrator. This was even more awkward because the sensitivity seems to drift up and down all the time. I guess that's what happens if you try to be cheap when you're buying measurement instruments... I bit the bullet and ordered a new (and expensive!) microphone from a big.name company with a good reputation (I believe). It may be a few days until I am back in operation.
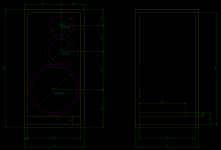
In the meantime I might continue with adding the woofer to the prototype box (will have to get some more MDF to complete the box). The way the prototype box is made so far the internal dimensions will be 324mm (width) x 688mm (height) x 368mm (depth) = 82 litres. Subtract the port volume and driver volumes to get to the volume that is relevant for the bass tuning. I'd guess 70 to 75 litres or so?
Kaffimann and everyone else: what port length would you suggest (with cross section 324 x 50mm as shown in post 271)?
Short answer to drag it out: Depends on what you want.
Personal preference: rough figure, 31-32cm somewhere, try to end it just over 6cm distance from the back wall, maybe just a little sanding on the edges to round them a tiny bit.
Edit:
OH! And have a 2-4cm thick layer of loose felt on top of the port closest to the driver, but not on the last 2-3cm before the end of the port. Adjust to taste. If you're lucky that's all the damping material we need, but I suspect it would be good to have some on the side walls closest to the driver also.
Last edited:
...rough figure, 31-32cm somewhere, try to end it just over 6cm distance from the back wall, maybe just a little sanding on the edges to round them a tiny bit.
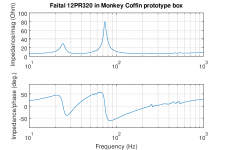
Ok, I built the Coffin just like you suggested and put all the drivers in. No damping material at all for the moment. Here's the impedance curve (plot and data file).
Tuning frequency is about 34.5 Hz (a bit lower than what we aimed for?). Should we try a shorter port? I guess the "corner" at the bottom/rear of the speaker is acting as part of the port as it is now, so the port is effectively quite a bit longer than one might think.
Impedance minimum is 5.9 Ohm (between the two main peaks). Almost within the "8 Ohm" rating (6.4 Ohm = 80% of 8 Ohm would be the generally accepted limit for for an "8 Ohm" rating). This will improve further once we add the x-over.
There are some wiggles at 55 Hz, 58 Hz, 257 Hz, 354 Hz, 375 Hz, 390 Hz, 468 Hz, 531 Hz and higher up, which might point at some internal resonances in the box. We'll have to take a look at those.
Let me know what you think.
Edit: added an updated drawing of the Monkey Coffin box to show the dimensions.
Attachments
Last edited:
I tried to fit the measured impedance on the one of the basrelex Leap model, but no optimal result till now. Succeeding in it, the corresponding SPL is correct too. I look to it later. It should be interesting to realize, because it is difficult to measure the low frequency SPL in a non-anechoic room. Maybe you can do some nearfield driver and port measurement also later.
Concerning the little ripple in the impedance curve at some frequencies. It looks like there is a ceiling resonance in your room around 60 Hz. Maybe looking to SPL also if there is a peak around 60 Hz?
Above 200 Hz, probably some internal cabinet and/or port resonances. Some more dampening material, walls covering needed maybe.
Mbrennwa, Paul, I stand by my suggestion, well knowing the total resonance is on the low side (it's intentional), the ripples up top are internal resonances and can be broken up by flat braces at irregular angles and locations, but also need some dampening material on walls very close to the cone. I think it will work very well in most normal rooms.
After some trials, I realized a reasonable good fitting of the basreflex system in Leap on the measured impedance. But I had to increase fs of the driver to 48 Hz. Otherwise it is not possible to become the wanted impedance. Qes and Vas get other values too, conform this higher fs (see attach).
The parameters I use in the Leap basreflex model are:
- Cabinet volume excl. port Vb = 69 L
- Filling cabinet: no
- Port length: 39 cm
- Filling port: no
- Tuning frequency fB = 37 Hz
- Fs = 48 Hz
In first plot, impedance measured (black) versus simulated (blue).
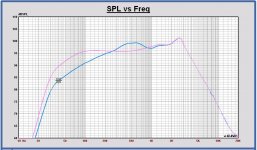
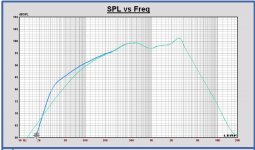
In second plot, SPL in cabinet infinite baffle (pink) versus in cabinet free space (blue).
SPL is conform the impedance fitting on the impedance measurement.
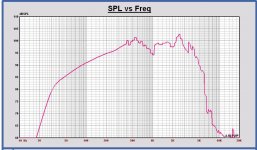
In third plot, SPL in cabinet with SPL correction added above 400 Hz (out of datasheet SPL). This curve is to be expected as full space response in an anechoic room.
With this free space SPL response a speaker can be designed with a 90 dB sensitivity free space 1m 2.83V, with F3 = 57.6 Hz and F6 = 40.9 Hz.
As a conclusion now, it is possible that the basreflex system model in Leap isn’t exactly correct, but the combination driver – cabinet settings is correct. As the impedance response of the model is conform the measurement, the SPL will be also and both can be used to compare with the SPL measurements and for further X-over design.
Maybe checking fs in free air again?
The reason I do this kind of work now in the Leap simulation is to create low frequency SPL responses as accurate as possible that can be spliced with "in cabinet" SPL measurements around 400 - 600 Hz to become good free space SPL responses for X-over design.
I have very good experience with this way of working for closed box systems. Basreflex is more complex, but it must be possible too.
The parameters I use in the Leap basreflex model are:
- Cabinet volume excl. port Vb = 69 L
- Filling cabinet: no
- Port length: 39 cm
- Filling port: no
- Tuning frequency fB = 37 Hz
- Fs = 48 Hz
In first plot, impedance measured (black) versus simulated (blue).
In second plot, SPL in cabinet infinite baffle (pink) versus in cabinet free space (blue).
SPL is conform the impedance fitting on the impedance measurement.
In third plot, SPL in cabinet with SPL correction added above 400 Hz (out of datasheet SPL). This curve is to be expected as full space response in an anechoic room.
With this free space SPL response a speaker can be designed with a 90 dB sensitivity free space 1m 2.83V, with F3 = 57.6 Hz and F6 = 40.9 Hz.
As a conclusion now, it is possible that the basreflex system model in Leap isn’t exactly correct, but the combination driver – cabinet settings is correct. As the impedance response of the model is conform the measurement, the SPL will be also and both can be used to compare with the SPL measurements and for further X-over design.
Maybe checking fs in free air again?
The reason I do this kind of work now in the Leap simulation is to create low frequency SPL responses as accurate as possible that can be spliced with "in cabinet" SPL measurements around 400 - 600 Hz to become good free space SPL responses for X-over design.
I have very good experience with this way of working for closed box systems. Basreflex is more complex, but it must be possible too.
Attachments
-
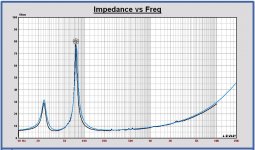 Measured vs. simulated impedance Monkey box.JPG122.9 KB · Views: 341
 -
 SPL infinite baffle and free space 1m 2.83V Monkey box.JPG143.2 KB · Views: 109
 -
 SPL infinite free space with correction above 400 Hz 1m 2.83V Monkey box.JPG145 KB · Views: 98
 -
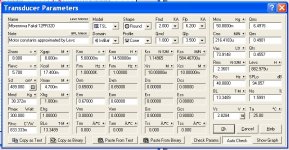 Adapted Leap trnsducer model Monkey box.JPG108.6 KB · Views: 105
There's a limit to how much one can conform to the originally desired impedance, while at the same time taking into account all the other limits of the design. I would like to say: Whatever we get now is "good enough", especially considering it is also "close enough" on all other pre decided design limitations. No need for further optimization in regards to FS/impedance IMO, maybe except higher tuning freq but that is up to each builder to decide.
WYSIWYG
Paul, this port tuning should be very similar to closed box in some ways. I expect some (audible but lower) output to just under 30hz.
WYSIWYG
Paul, this port tuning should be very similar to closed box in some ways. I expect some (audible but lower) output to just under 30hz.
Hi Kaffimann,
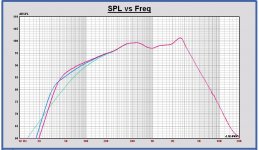
Still some difference versus closed box (green) for this basreflex setting (blue). But remark, for this driver in this cabinet with a closed box, Qtc is around 0.55.
This basreflex is more damped than a B4. In second plot B4 response added (red) with tuning frequency = 43 Hz (port length 26 cm)
Yes, it is a personal choice of the builder which one to use. My personal choice is the actual setting.")
Still some difference versus closed box (green) for this basreflex setting (blue). But remark, for this driver in this cabinet with a closed box, Qtc is around 0.55.
This basreflex is more damped than a B4. In second plot B4 response added (red) with tuning frequency = 43 Hz (port length 26 cm)
Yes, it is a personal choice of the builder which one to use. My personal choice is the actual setting.
Attachments
After some trials, I realized a reasonable good fitting of the basreflex system in Leap on the measured impedance. But I had to increase fs of the driver to 48 Hz.
I messed around a bit with AJ horn. I found that adding a little bit of damping to the bass reflex port decreases the size of the impedance peaks, whereby the lower peak is affected more. While there is no damping material in the actual build, I guess there is a bit of damping due to high air flow and turbulence, especially at low frequencies. I don't think the model tools account for turbulent losses, which would explain why the model tools don't provide an accurate fit to the observed impedance curve.
If I don't change fs of the driver from 43.1 to 48 Hz, the frequency of the lower peak doesn't fit correct or has a lower Q factor while the upper peak fits. So I am wondering after a long period of burning in your driver, if the fs isn't increased again? It really looks like that in my simulation. Or temperature in your measurement room is not the same?
For sure the model tools will give deviations, I believe that, but the difference I see in Leap with fs = 43 Hz is too large.
Edit: It isn't a problem if a good fitting cannot be realized with fs = 43 Hz. If an impedance fit is realized with fs = 48 Hz, a correct SPL is obtained. That one can be used for further design, together with the measured impedance.
Last edited:
Don't remember if this was posted before, dome tweeters and waveguides:
Wave guides & horns
Wave guides & horns
Don't remember if this was posted before, dome tweeters and waveguides:
Wave guides & horns
This is a very interesting site. I already used a lot of the measurements to calculate the directivity index of different tweeter concepts.
So I am wondering ... if the fs isn't increased again? It really looks like that in my simulation. Or temperature in your measurement room is not the same?
Of course! I've had this effect before... I just repeated the impedance measurement after warming the surround a bit, and the impedance peaks were shifted a bit. I'll do a proper measurement later. The compliance of the cloth surround really seems to change quite a bit with temperature!
Eagerly anticipating results now that the first box has been built!
Me too. I am still waiting for my replacement microphone to arrive. The store promised to send it early this week, but that didn't happen.
In the meantime I used my fishy microphone for some nearfield measurements. I can't trust the absolute SPL levels, but I clearly see the SPL dip of the woofer at the tuning frequency of the box. I was a bit surprised to see that this is actually a bit lower (31 Hz or so) than what the electrical impedance measurement suggested (35 Hz or so). Why is this? How is the acoustic tuning different from the electronic world?
Again, I'll do (and show) some more careful measurements once I have a microphone I can trust.
- Home
- Loudspeakers
- Multi-Way
- Open Source Monkey Box