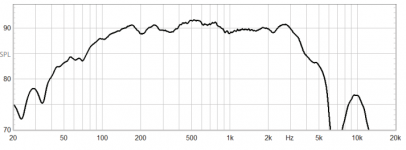
It does not matter too much because it is already down by 20 dB and it is likely to be even further suppressed by an electrical low pass filter. I would trace the lower scale limit or an estimate of the curve.
By the way, there appear to be more versions of this Volt BM220 woofer with for example a significant difference around the 2 kHz peak:
https://voltloudspeakers.co.uk/wp-content/uploads/2014/03/BM220.1.pdf
https://voltloudspeakers.co.uk/wp-content/uploads/2014/12/BM220.8.pdf
By the way, there appear to be more versions of this Volt BM220 woofer with for example a significant difference around the 2 kHz peak:
https://voltloudspeakers.co.uk/wp-content/uploads/2014/03/BM220.1.pdf
https://voltloudspeakers.co.uk/wp-content/uploads/2014/12/BM220.8.pdf
Last edited:
It does not matter too much because it is already down by 20 dB and it is likely to be even further suppressed by an electrical low pass filter. I would trace the lower scale limit or an estimate of the curve.
By the way, there appear to be more versions of this Volt BM220 woofer with for example a significant difference around the 2 kHz peak:
https://voltloudspeakers.co.uk/wp-content/uploads/2014/03/BM220.1.pdf
https://voltloudspeakers.co.uk/wp-content/uploads/2014/12/BM220.8.pdf
Thanks for your response. I have contacted Volt to clarify this difference. As I understand it, the BM220.8 and the BM228.8 are the same but the part number designation is all that has changed.
- Status
- This old topic is closed. If you want to reopen this topic, contact a moderator using the "Report Post" button.
