Tool for visualization
Interesting read!
I made a small tool (excel-sheet) to help myself grasp some things regarding line arrays and thought that maybe someone else could use it as well.
It assumes discrete (monopole) sources and lets you play with
So if we set the following:

and if we increase distance to 4 m:

a reduction of 12 dB (as expected). Let's add floor and ceiling reflections (2.4 m room height, mic at 1 m above floor):

Looks like a normal indoor measurement of a low directivity speaker.
How about a 10 driver array with 0.1 m spacing with centre 0.8 m above the floor:

How about a floor-to-ceiling array with 25 drivers (9.5 cm spacing):

Follows the theoretical -3dB/octave line up to about 3.5 kHz.
And if we increase distance to 8 m:

a reduction of 3 dB (as expected). Follows the theoretical line up to about 5 kHz.
It's a simple tool, but helped me understand line arrays better. I hope someone else will find it useful. It's attached as "line array calc v1.mp4", just rename it to *.zip and and unzip.
If you find any errors, please tell me! Or if you have any suggestions on how to improve it. I'm trying to figure out how to add directivity to each driver
/Anton
Interesting read!
I made a small tool (excel-sheet) to help myself grasp some things regarding line arrays and thought that maybe someone else could use it as well.
It assumes discrete (monopole) sources and lets you play with
- driver spacing
- room height
- array length (number of drivers)
- array placement (distance from floor)
- reflections on/off (floor and ceiling)
- distance from array to microphone
- driver output (dB SPL @ 1 m for 1 driver)
So if we set the following:
- 1 driver
- 1 m distance to mic
- no reflections
- 90 dB output
and if we increase distance to 4 m:
a reduction of 12 dB (as expected). Let's add floor and ceiling reflections (2.4 m room height, mic at 1 m above floor):
Looks like a normal indoor measurement of a low directivity speaker.
How about a 10 driver array with 0.1 m spacing with centre 0.8 m above the floor:
How about a floor-to-ceiling array with 25 drivers (9.5 cm spacing):
Follows the theoretical -3dB/octave line up to about 3.5 kHz.
And if we increase distance to 8 m:
a reduction of 3 dB (as expected). Follows the theoretical line up to about 5 kHz.
It's a simple tool, but helped me understand line arrays better. I hope someone else will find it useful. It's attached as "line array calc v1.mp4", just rename it to *.zip and and unzip.
If you find any errors, please tell me! Or if you have any suggestions on how to improve it. I'm trying to figure out how to add directivity to each driver
/Anton
Attachments
Limits of the tool
The tool has some limits:
/Anton
The tool has some limits:
- Only monopole behavior, no directivity or frequency dependence
- Maximum of 200 drivers
- No walls, only floor and or ceiling
- Only straight and uniform arrays (constant spacing)
- Gives results for impossible inputs, e.g. longer array than room height, check right column if any cell is red!
- Only primary and secondary reflections (sound does not bounce a third time)
- Resolution is only 100 points/decade, so a total of 232 frequencies between 100 och 20 000 Hz.
/Anton
Last edited:
Interesting read!
I made a small tool (excel-sheet) to help myself grasp some things regarding line arrays and thought that maybe someone else could use it as well.
It assumes discrete (monopole) sources and lets you play with
- driver spacing
- room height
- array length (number of drivers)
- array placement (distance from floor)
- reflections on/off (floor and ceiling)
- distance from array to microphone
- driver output (dB SPL @ 1 m for 1 driver)
So if we set the following:
we get:
- 1 driver
- 1 m distance to mic
- no reflections
- 90 dB output
View attachment 761458
and if we increase distance to 4 m:
View attachment 761459
a reduction of 12 dB (as expected). Let's add floor and ceiling reflections (2.4 m room height, mic at 1 m above floor):
View attachment 761460
Looks like a normal indoor measurement of a low directivity speaker.
How about a 10 driver array with 0.1 m spacing with centre 0.8 m above the floor:
View attachment 761462
How about a floor-to-ceiling array with 25 drivers (9.5 cm spacing):
View attachment 761463
Follows the theoretical -3dB/octave line up to about 3.5 kHz.
And if we increase distance to 8 m:
View attachment 761464
a reduction of 3 dB (as expected). Follows the theoretical line up to about 5 kHz.
It's a simple tool, but helped me understand line arrays better. I hope someone else will find it useful. It's attached as "line array calc v1.mp4", just rename it to *.zip and and unzip.
If you find any errors, please tell me! Or if you have any suggestions on how to improve it. I'm trying to figure out how to add directivity to each driver
/Anton
Very cool, thank you.
Your model reflects rather similar results I've seen using 24 3" TC9s.
I can confirm this behaviour for my arrays. If I stand up, the perceived stage moves up with me. It's a bit weird the first time. No changes in the perceived tonal balance..
That is the nicest thing with arrays, and used in nearfield. I hate when the tonal balance change when i stand up, i never hear such tonal changes when listening to live music and where listening distance is much larger then at home
I'm trying to figure out how to add directivity to each driver
/Anton
If all the drivers are the same then adding in directivity from the drivers is trivial. Just multiple the final directivity by the directivity of the driver. If they are different then this doesn't work.
Its a linear system so the sum of the products of two functions where one is the same for all the sums then this is the same as the common function times the sum.
Surely the off axis response of the drivers might be the highest priority. Most of these cheaper drivers being used in arrays lack this off axis quality.
BTW nice software, it's a great approximation.
It sure would be interesting to make an array using the 3" BMR:
Tectonic TEBM46C20N-4B BMR 3" Full-Range Speaker 4 Ohm
The resonance frequency is pretty high, though... but this is the multi-way forum. The off axis response is much better than typical 3" drivers.
I proposed in another thread using the Dayton PT Mini in a vertical line along with the TC9 specifically to address the off axis response.
https://www.parts-express.com/pedocs/specs/275-083--dayton-audio-ptmini-6-specifications.pdf
https://www.parts-express.com/pedocs/specs/275-083--dayton-audio-ptmini-6-specifications.pdf
But the disadvantage is the large intensity of the first reflection which can be avoided altogether with a high DI point source. A high DI line array might alleviate that issue, but I have never seen anyone do that (except in large pro installations.)
Is the desire for Hi directivity or Constant directivity across the freq spectrum?
My listening experiences with Magnepan speakers is they do this very very well. A very recent listening of the 1.7i was a revealing experience and what’s possible with their new LRS is astonishing for the $$$.
Older posts, I know......but worth addressing attempts to combat horizontal directivity in nearfield arrays. Would an array of open baffle or dipole TC9s accomplish this?.....the TC already has a very high QTS making it somewhat suitable and the new SBAcoustics 3” has an even higher QTS.
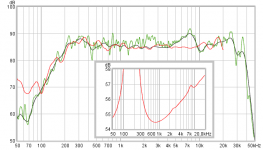
Tend to agree with nc535 that out of box its hard to get those nice smooth BMR factory curves, in red trace below is TEBM46C20N-4B factory curve verse my diy 192kHz rate session on a relative big dual cardboard baffle of size around 100-120 centimeter times 120-140 centimeter, green trace is 1/24 smoothing and black trace is FDW (6 width in cycles), zooming into DATS measurement we can see the two blib where response is worst. That said driver here was simply front mounted so who knows if one works with that weird frame figure to get it implemented smooth and flush into enclosure help with a smoother curve.

Attachments
Thanks for the kind words ")
I'm unsure whether the phase response off-axis is identical to ditto on-axis. Is it that simple? So that the only thing needed to know phase between two identical drivers is the difference in distance? I made a new version of the excel-sheet with this assumption to experiment with vertical directivity of each driver and to see how this affects the combined response.
Directivity modelling
Directivity is modeled by a frequency dependent response as function of off-axis angle. So on axis the frequency response is typically 0 dB from 100-20000 Hz. The at increasing angles the response decreases. You can either make your own curves in the Directivity tab (0-90 deg) or use the included assumption that the curves can be described using the formula:
on_axis_response-separation*(frequency/max_frequency)^slope*off_axis_angle
with this formula you can get
- constant directivity by setting slope = 0
- something resembling normal tweeter behavior by setting slope = ~1 and appropriate separation (0.5?)
Input it
- separation, which sets the separation between lines at 20 kHz multiplied by angle (so separation = 1 gives -45 dB at 45 deg).
- slope, which sets shape of curve
On-axis response
I also added a simple way to choose an on-axis response to counteract the downward slope with the formula
(frequency/max_frequency)^slope_0deg*elev_20
where
slope_0deg sets the shape of the curve and elev_20 sets hos much output is increased at 20 kHz.
Note that increasing on-axis output also increases off-axis output.
Examples
With FTC-array of 42 drivers at 4 m and parameters slope = 2 and separation = 0.5:


No huge difference to monopole behavior.
What if we increase directivity (waveguide?) and set parameters slope = 1 and separation = 1:


Looks a little better, more even response above 7 kHz (less to fix with DSP).
What if we add that output increases with frequency by setting slope_0deg =0.6 and elev_20 = 12 dB:

Note that all curves are modified.

Not bad! (Note also that the "Without directivity"-curve is unaffected).
Let's take it to the extreme, what if we magically can make an array where the directivity only allows positive summing. So that when the off-axis angle causes negative summation (phase angle of more than 90 deg) the output drops to -100 dB:


Increased output all the way and a lot more even frequency response Not possible to physically make though
File
The spread-sheet is attached, just rename to *.zip and unpack.
/Anton
I'm unsure whether the phase response off-axis is identical to ditto on-axis. Is it that simple? So that the only thing needed to know phase between two identical drivers is the difference in distance? I made a new version of the excel-sheet with this assumption to experiment with vertical directivity of each driver and to see how this affects the combined response.
Directivity modelling
Directivity is modeled by a frequency dependent response as function of off-axis angle. So on axis the frequency response is typically 0 dB from 100-20000 Hz. The at increasing angles the response decreases. You can either make your own curves in the Directivity tab (0-90 deg) or use the included assumption that the curves can be described using the formula:
on_axis_response-separation*(frequency/max_frequency)^slope*off_axis_angle
with this formula you can get
- constant directivity by setting slope = 0
- something resembling normal tweeter behavior by setting slope = ~1 and appropriate separation (0.5?)
Input it
- separation, which sets the separation between lines at 20 kHz multiplied by angle (so separation = 1 gives -45 dB at 45 deg).
- slope, which sets shape of curve
On-axis response
I also added a simple way to choose an on-axis response to counteract the downward slope with the formula
(frequency/max_frequency)^slope_0deg*elev_20
where
slope_0deg sets the shape of the curve and elev_20 sets hos much output is increased at 20 kHz.
Note that increasing on-axis output also increases off-axis output.
Examples
With FTC-array of 42 drivers at 4 m and parameters slope = 2 and separation = 0.5:
No huge difference to monopole behavior.
What if we increase directivity (waveguide?) and set parameters slope = 1 and separation = 1:
Looks a little better, more even response above 7 kHz (less to fix with DSP).
What if we add that output increases with frequency by setting slope_0deg =0.6 and elev_20 = 12 dB:
Note that all curves are modified.
Not bad! (Note also that the "Without directivity"-curve is unaffected).
Let's take it to the extreme, what if we magically can make an array where the directivity only allows positive summing. So that when the off-axis angle causes negative summation (phase angle of more than 90 deg) the output drops to -100 dB:
Increased output all the way and a lot more even frequency response
Not possible to physically make though File
The spread-sheet is attached, just rename to *.zip and unpack.
/Anton
Attachments
Error for "bottom driver" in last excel-sheet
I found an error in the excel-sheet in the previous post. It only affected the "bottom driver" so long array behavior was almost unaffected. But when I tried simulating a single driver the error became apparent. Attached is an updated version.
I was experimenting with constant directivity vs traditional speakers. A highly directional constant directivity speaker seems to behave well:


Compared to a traditional (non-directional up to a few kHz and then narrowing):

Might be quite difficult to achieve that level of directivity though.
/Anton
I found an error in the excel-sheet in the previous post. It only affected the "bottom driver" so long array behavior was almost unaffected. But when I tried simulating a single driver the error became apparent. Attached is an updated version.
I was experimenting with constant directivity vs traditional speakers. A highly directional constant directivity speaker seems to behave well:
Compared to a traditional (non-directional up to a few kHz and then narrowing):
Might be quite difficult to achieve that level of directivity though.
/Anton
Attachments
Hi Onni:
I love this spreadsheet. Its very timely as I'm building/experimenting with line arrays now. You might find it interesting to compare your results with those produced in Vituix, which can also model line arrays taking driver directivity into account, although with fewer maximum drivers.
A suggestion re' directivity: it would be "nice" to just enter a piston diameter and then have you compute the directivity roll off from that.
Thanks for doing this.
Jack
Great that it is appreciatedHi Onni:
I love this spreadsheet. Its very timely as I'm building/experimenting with line arrays now. You might find it interesting to compare your results with those produced in Vituix, which can also model line arrays taking driver directivity into account, although with fewer maximum drivers.
A suggestion re' directivity: it would be "nice" to just enter a piston diameter and then have you compute the directivity roll off from that.
Thanks for doing this.
Jack
Good suggestion, not sure how to do it though... Is there an easy formula?
/Anton
Great that it is appreciated
Good suggestion, not sure how to do it though... Is there an easy formula?
/Anton
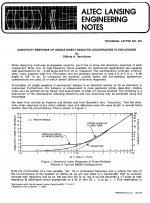
member InOtIn share a spreadsheet here: https://www.diyaudio.com/forums/mul...ctivity-dispersion-beamwidth.html#post4656518
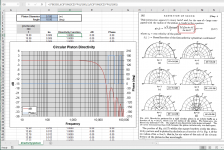
The directivity equation for a circular piston uses Bessel functions, which fortunately Excel has as a built in intrinsic function.... Is there an easy formula?
In the attached screen grab, you can see the required equation in the Excel formula bar.
Note that the polarity inverts at each off-axis lobe as you go up in frequency
The spreadsheet is also attached in *.zip file for those who happen to have Excel and want to play around.
The “ka” parameter is the ratio of the piston circumference to the wavelength.
ka = (2*pi*f/c) * (d/2) = (pi*d) / (c/f)
where:
f = frequency (hz)
c = speed of sound = 343 (m/s)
d = diameter of piston (m)
Attachments
- Status
- This old topic is closed. If you want to reopen this topic, contact a moderator using the "Report Post" button.
- Home
- Loudspeakers
- Multi-Way
- Infinite Line Source: analysis