The issue at 13 kHz is aliasing from the point spacing. My choice of 0, 5, 10 etc. comes from my desire to get good data up to 10 kHz with the least number of points.
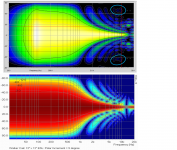
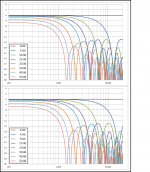
Is it aliasing that is resulting in the circled response areas in Attachment #1 that are not contained in the source data set? If so, would it help to stagger the first few increments rather than using equal 5 degree spacing? For example, Attachment #2 compares 5 degree spacing with initial increment size of 4, 5, & 6 degrees. This would keep notches in multiple response curves from aligning and would provide some output across the top octave for your process to operate on no matter how directive the source. I could easily send you a new version of the test case using these angles if you are curious what the results would be. This also brings up again my question in post# 61 about required tolerance on the measurement angles. If I have understood your previous responses correctly, it isn't critical if 1) the source isn't too directive, or 2) the main area of interest is < 10Khz even with a highly directive source. Is that correct?
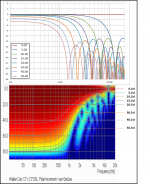
Concerning ARTA sonograms: Attachment #3 shows the response for your first 8 chosen angular slices thru the sonogram. As the author states, you can clearly see that 2-D interpolation is used and I see no problem with that. I am puzzled why you at times have suggested or implied the methods used are faulty(perhaps you didn’t mean it that way, but that is how it came across). It is a simple, stable method that gives reasonable results and its limitations are known and understood. I guess I don’t see this as being any different than making sure the limitations of your reconstruction method are known and understood. This was part of the reason for the extreme test case…to help understand the limitations and behaviors when limits are exceeded. If the desire is a database to compare different speaker designs, you need to make sure that none of the designs (when measured) approach the limitations of the process.
Your technique of modeling the entire polar from a few select measurements reminds me of the DOE(Design of Experiments) method that I have seen used in wind tunnel testing to define as much of the design space(first and higher order interactions between design variables) with as few measurement configurations as possible. Time = $.
This may be true for dynamic drivers, but uniformly driven planar radiators(ribbons or ESLs) have no difficulty generating narrow polar responses like this. 12" is actually a very common width for DIY ESLs. Here are some measurements I posted for a popular 6" planar ribbon. The notch for 6" radiator with 5 degree increments forms at 26kHz so is not seen in the measurements, although it is present in the "theory" curves on plot #3.…The example shown before was a worse case that one would never see in practice - it was simulated data. At these frequencies a real source would not be rigid and the polar response would never be so narrow, so what we saw there would not happen.
http://www.diyaudio.com/forums/plan...ispersion-planars-how-much-2.html#post2271679
Attachments
Last edited:
Ok, I thought with “locked” you actually meant "Keep in/out stream active", and this is what I have done. I did read your instructions, but for users who never work with holm, the brief instructions might not always be clear enough (or at least for me anyway)
So, to be sure were are talking about the same "locking" now:
- first measurement (at zero degrees) should have "detect time zero" enabled (see pic)
- after the first measurement is completed, I should select "time zero locked (time alignment)" and use the "last detected offset" by clicking the “use” button
- all following measurements should be taken like this
Is this correct?
Yes, that is exactly correct. And remember to rotate about the enclosures middle not the baffle or some assumed acoustic center.
I agree...it is rather surprising considering the apparent effort put into increasing the source size with falling frequency.
At one time they had mentioned that the ESL-63 polar would be added to their web page.
That would have been very interesting to see as well.
According to Toole, the Quad performed very badly in a blind test (unpublished). In a private conversation that we had, he used that as an example for why high directivity is not desirable. I mentioned that maybe the specific directivity control was not very good, but he did not believe that would make a big difference. This is the one area where Floyd and I disagree, but I think that his supporting data is weak.
Do you know, was this the original Quad ESL-57? or the later ESL-63 that used delay lines.According to Toole, the Quad performed very badly in a blind test (unpublished)
Those off axis areas would not be aliasing, but limited resolution off axis.Is it aliasing that is resulting in the circled response areas in Attachment #1 that are not contained in the source data set? If so, would it help to stagger the first few increments rather than using equal 5 degree spacing? For example, Attachment #2 compares 5 degree spacing with initial increment size of 4, 5, & 6 degrees. This would keep notches in multiple response curves from aligning and would provide some output across the top octave for your process to operate on no matter how directive the source. I could easily send you a new version of the test case using these angles if you are curious what the results would be. This also brings up again my question in post# 61 about required tolerance on the measurement angles. If I have understood your previous responses correctly, it isn't critical if 1) the source isn't too directive, or 2) the main area of interest is < 10Khz even with a highly directive source. Is that correct?
I think that staggered angles would be a good idea. I could test that, but not easily, it would take some code rewritten and I could not easily implement an angle change in my setup without rebuilding the stand. If you want to send me the data at different angles I'll see what I can do, but I remain unconvinced that there are any real issues here.
You are basically correct that I don't worry much about > 10 kHz, so "less accurate" data is OK with me in that region. And if the source is not highly directive then the issues are far less. Who would actually design a speaker to have a 2 degree coverage angle at 10 kHz? I have never seen this in practice and while such a thing might be possible I do not see it as probable.[/QUOTE]
Concerning ARTA sonograms: Attachment #3 shows the response for your first 8 chosen angular slices thru the sonogram. As the author states, you can clearly see that 2-D interpolation is used and I see no problem with that. I am puzzled why you at times have suggested or implied the methods used are faulty(perhaps you didn’t mean it that way, but that is how it came across).
All that I ever said about ARTA was that I expected that angular interpolation was used - I was right. There are good ways and bad ways to do that. I have no idea which he did. ARTA data always looks better to me than what I get - that makes me suspicious, but I have no more data than that on which to base an opinion. When we have more comparisons - right now we have no real world comparisons - then we will have a better idea of what the issues are. I have used my techniques far longer than ARTA has even been available, so by now I am quite confident in them - not that this came without some bumps in the road mind you.
I agree on the limitations, but I would also say that one should err on the side of expecting a "better" design and optimizing for that rather than expecting a "poor" one and optimizing for that. Lets not make "being perfect" be the enemy of "being good". We need what works satisfactorily not what is perfect.
Time = $.
Always true
Do you know, was this the original Quad ESL-57? or the later ESL-63 that used delay lines.
No I don't. It was quite awhile ago.
Bolserst
The data fit is done in a shifted set of angles using cosine(theta). So the ideal would be a set spaced in those coordinates with a higher density at 1 than at -1. Nice project if you want to do it, I just didn't, and still don't, see the need.
Optimizing the analysis around a square source is also probably not a good idea because they have different properties than round sources - different null locations for example.
I choose 5 degree increments because my stand was already laid out in 5 degree increments. I original did this at 5 degree increments all the way around, but then I realized what I mentioned above. One wanted a set that optimized the data at 1 when transformed by cos(theta). I was able to get the same results with the 14 data sets as I did before with 37. Why do I want to do more work for nothing? Time = $")
The data fit is done in a shifted set of angles using cosine(theta). So the ideal would be a set spaced in those coordinates with a higher density at 1 than at -1. Nice project if you want to do it, I just didn't, and still don't, see the need.
Optimizing the analysis around a square source is also probably not a good idea because they have different properties than round sources - different null locations for example.
I choose 5 degree increments because my stand was already laid out in 5 degree increments. I original did this at 5 degree increments all the way around, but then I realized what I mentioned above. One wanted a set that optimized the data at 1 when transformed by cos(theta). I was able to get the same results with the 14 data sets as I did before with 37. Why do I want to do more work for nothing? Time = $
You are basically correct that I don't worry much about > 10 kHz, so "less accurate" data is OK with me in that region. And if the source is not highly directive then the issues are far less. Who would actually design a speaker to have a 2 degree coverage angle at 10 kHz? I have never seen this in practice and while such a thing might be possible I do not see it as probable.
I think the issue is more one of catching two issues. First an unintentional narrowing of the radiation pattern above 10 KHz. Things like diffraction do not necessarily work like our visual sense wants them to. Everything from poor driver design to overly styled treatments around the tweeter can have unintentional effects. Second unexpected off axis radiation. I encountered an extreme example of this on a novel speaker and had really strong HF at 90 degrees off axis and on axis but not much between. Manger Audio - The Zerobox Technical specifications
I think building a database of polar patterns for commercial speakers is a good idea. The challenge in getting acceptance of its importance is in explaining why its important and how to interpret it. Fighting the marketing desire to reduce it to a number will be a major part of the battle. The pro sound market has "directivity index" proAV / data and information, lists, tables and links as a number but its no substitute for looking at the pattern and comparing it to the problem to be solved.
Understood. I will send the data set…not rush on processing as it is merely to satisfy intellectual curiosity.I think that staggered angles would be a good idea. I could test that, but not easily, it would take some code rewritten and I could not easily implement an angle change in my setup without rebuilding the stand. If you want to send me the data at different angles I'll see what I can do, but I remain unconvinced that there are any real issues here.
As I mentioned previously, Roger Sanders.Who would actually design a speaker to have a 2 degree coverage angle at 10 kHz?
I think he is the only current manufacturer of highly directive speakers…there were others in the past.
His speakers have quite a following, but I could not live with the “head-in-a vice” listening requirements no matter how good the sound.
Sanders Sound Systems - Electrostatic Speakers
Some Stereophile measurements for a discontinued model here: (lateral response plot attached)
InnerSound Eros Mk.III electrostatic loudspeaker Measurements part 2 | Stereophile.com
Fair enough. I wonder if some of the differences have to do with “standard” 1/12 oct smoothing .vs. the critical bands smoothing that you are using? If you could process using a 1/12 or 1/6 oct smoothing that might be a more "apples-to-apples" comparison with ARTA sonograms. BTW, I included ARTA sonograms for the Phoenix Dipole clone when I sent the HOLM data. When you have time to reprocess with monopole assumption turned off, that should be a good data point. As I recall, I had a nice clean 7mS measurement window. Let me know if you don’t still have the ARTA plots, I can regenerate them.ARTA data always looks better to me than what I get - that makes me suspicious, but I have no more data than that on which to base an opinion. When we have more comparisons - right now we have no real world comparisons - then we will have a better idea of what the issues are.
Agreed. Just realize that most people(me included) don’t understand the nuances of how your process works, where as you have been working at refining it for years geared toward your application and a particular set of measurement angles. It is only natural to be a little skeptical and want to understand/test the limits and tolerances to see if something unexpected results.… Lets not make "being perfect" be the enemy of "being good"
Attachments
Last edited:
The data fit is done in a shifted set of angles using cosine(theta). So the ideal would be a set spaced in those coordinates with a higher density at 1 than at -1. Nice project if you want to do it, I just didn't, and still don't, see the need.
Optimizing the analysis around a square source is also probably not a good idea because they have different properties than round sources - different null locations for example.
Aaah, got it.
I would be interested in seeing what might be done to optimize the results for a set number of measurement angles.
I will take a stab at defining a better angular spacing next week.
Yes, I can use a round source if you prefer.
Originally Posted by _Wim_ View Post
Ok, I thought with “locked” you actually meant "Keep in/out stream active", and this is what I have done.
Just a caveat -- don't assume all sound cards use the same reference clock for record and playback. There are some that use an entirely different source for playback as for record, so you won't get them to lock because of the (even quite small) differences in sample rate. For instance, audio interfaces based on the Texas Instruments PCM290x series chips use the USB clock for recording and a separate crystal for playback. Some popular devices that use these parts are the iMic and Behrenger USB interfaces). I've seen some motherboards also to have this problem (not sure what chips they had inside). The way to tell is to "lock" an impulse response from a speaker and leave things set up while continuing to watch successive impulses. Mismatched rates will cause the IR to drift forward or back, usually visible over 10 seconds or so (but some on every single cycle).
Agreed. Just realize that most people(me included) don’t understand the nuances of how your process works, where as you have been working at refining it for years geared toward your application and a particular set of measurement angles. It is only natural to be a little skeptical and want to understand/test the limits and tolerances to see if something unexpected results.
Understood and accepted.
I will try and teach the skeptics what I know as long as the discussion is civil. I will not deal with impolite. It is very true that this technique is new and no one else does it, but that does not make it wrong. People are always skeptical of the new, that's just nature, but the true professional is always looking for the new that benefits his work. Not doing so causes stagnation - which could be the hash tag for "loudspeaker technology" - #stagnant_loudspeaker_technology.
Horns had not changed in decades till I showed that they could be better.
Just a caveat -- don't assume all sound cards use the same reference clock for record and playback. There are some that use an entirely different source for playback as for record, so you won't get them to lock because of the (even quite small) differences in sample rate. For instance, audio interfaces based on the Texas Instruments PCM290x series chips use the USB clock for recording and a separate crystal for playback. Some popular devices that use these parts are the iMic and Behrenger USB interfaces). I've seen some motherboards also to have this problem (not sure what chips they had inside). The way to tell is to "lock" an impulse response from a speaker and leave things set up while continuing to watch successive impulses. Mismatched rates will cause the IR to drift forward or back, usually visible over 10 seconds or so (but some on every single cycle).
Bill, are we talking ms. here or micro-s? A sample variance or two is not going to be a big issue. In the above case where it was an issue it was several ms. because Holm locked on to the wrong impulse. That is an issue.
At any rate, I was unaware of what you are saying, but have not seen it in any of my work to date.
Outdoor measurements complete. I'm glad I did that, there's quite a bit below 1khz that I was missing in my shorter gate inside data. That said, I was having trouble locking the time in Holm. I think it's because I use a separate DAC and mic preamp, and I have audio software that grabs the audio that Holm sends to the default Windows driver for processing. I manually had it detect the largest peak for each measurement, and offset by hand the last few to get them inline.
You said you don't want them gated, so when I export the full data set from Holm is the gate included? I exported each impulse as a .wav file so I could look at all the data in REW, and my gate was included there.
I measured the Pioneer bookshelf, and honestly I think it's broke
Not sure if I want to submit this:
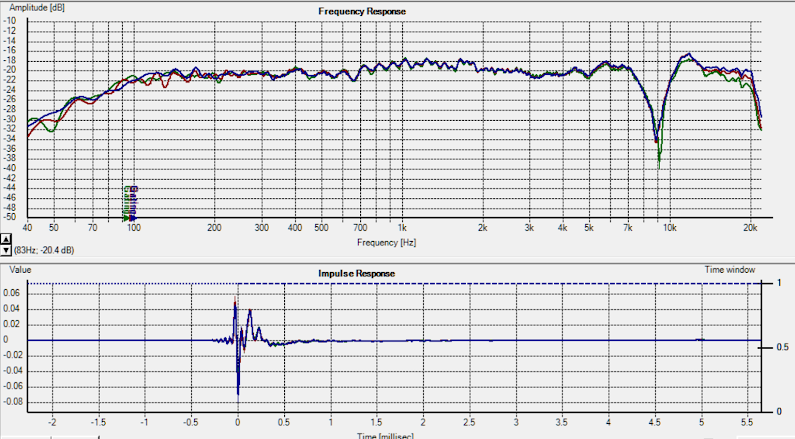
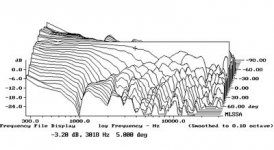
That 9khz notch is evident until about 20° off axis.
You said you don't want them gated, so when I export the full data set from Holm is the gate included? I exported each impulse as a .wav file so I could look at all the data in REW, and my gate was included there.
I measured the Pioneer bookshelf, and honestly I think it's broke
Not sure if I want to submit this:
That 9khz notch is evident until about 20° off axis.
Users would be wise to carefully read the procedure. the problems caused by not locking the time base can be significant.
Does setting up a loopback correction give the same results as a time-lock in Holm?
I'm not familiar with Holm, as it's a Windows program. I use FuzzMeasure on my Mac for audio measurements. It doesn't do time lock that I could see, but is designed to use loopback correction.
Outdoor measurements complete. I'm glad I did that, there's quite a bit below 1khz that I was missing in my shorter gate inside data. That said, I was having trouble locking the time in Holm. I think it's because I use a separate DAC and mic preamp, and I have audio software that grabs the audio that Holm sends to the default Windows driver for processing. I manually had it detect the largest peak for each measurement, and offset by hand the last few to get them inline.
You said you don't want them gated, so when I export the full data set from Holm is the gate included? I exported each impulse as a .wav file so I could look at all the data in REW, and my gate was included there.
I measured the Pioneer bookshelf, and honestly I think it's broke
Not sure if I want to submit this:
That 9khz notch is evident until about 20° off axis.
Now that's what i call measurement. I would like to see more people giving their measurements in 1dB or 2dB grid but that's really rare. We see 5dB or even 10dB gridline. What am i going to see from that other than really big issues that pops up. I always give my measurements in 2dB gridlines so if anything is wrong it becomes obvious.
Other than that notch the FR of that loudspeaker looks good. Could it be malfunction ? I doubt that it is intended to play like that. Thanks for this measurement
Actually that's how Holm defaults the grid lines. I typically use ARTA or REW and I use 5dB lines there. It's not the grid lines that's important it's the scale. A 40dB scale is the same look at the data whether you have 20dB grid or a 1dB grid.
I should have tested the other speaker to see if it behaves in the same way but my neighbor had just got home and was firing up his grill. His grill is about 10' from my deck so I didn't want to bug him.
Bill, are we talking ms. here or micro-s? A sample variance or two is not going to be a big issue. In the above case where it was an issue it was several ms. because Holm locked on to the wrong impulse. That is an issue.
At any rate, I was unaware of what you are saying, but have not seen it in any of my work to date.
Earl,
No, this is a long term very slightly different sample rate, with the recording not synchronous with the playback and the integrated error (apparent delay) increasing over time. If you want to see an example, pick up one of the inexpensive Behrenger USB audio interfaces and try with that. I learned that lesson the hard way with calls from customers who were unable to get synchronous averaging to work with Praxis when configuring a portable laptop based measuring system using those kinds of USB devices.
Outdoor measurements complete. I'm glad I did that, there's quite a bit below 1khz that I was missing in my shorter gate inside data. That said, I was having trouble locking the time in Holm. I think it's because I use a separate DAC and mic preamp, and I have audio software that grabs the audio that Holm sends to the default Windows driver for processing. I manually had it detect the largest peak for each measurement, and offset by hand the last few to get them inline.
That is not actually correct, Holm will do that as well. As the box is rotated the impulse do and should arrive later and later in time.
I never realized that this was such a big issue. I have used numerous different computers over the years and none has had these problems.
Does setting up a loopback correction give the same results as a time-lock in Holm?
I'm not familiar with Holm, as it's a Windows program. I use FuzzMeasure on my Mac for audio measurements. It doesn't do time lock that I could see, but is designed to use loopback correction.
I do not know if a loopback would work. Seems to me that will only correct for frequency response and lag errors in your system. It will not lock the time base of each measurement.
Earl,
No, this is a long term very slightly different sample rate, with the recording not synchronous with the playback and the integrated error (apparent delay) increasing over time. If you want to see an example, pick up one of the inexpensive Behrenger USB audio interfaces and try with that. I learned that lesson the hard way with calls from customers who were unable to get synchronous averaging to work with Praxis when configuring a portable laptop based measuring system using those kinds of USB devices.
Hi Bill - yes I can see where this would null out any advantage of synchronous averaging. I wish that Holm would do synchronous averaging. But it does not seem to be an issue that would affect what I do. At least not to any great extent.
Can Praxis export an array of impulse responses as a single file? Could it do this in a similar format to Holm?
I sound like a big fan of Holm, but that is just because it works. When I wanted to try the Farina technique Holm was free and it did this technique very well. Not many other software did. Since I just wanted to try the technique and I always did any post processing myself, I did not want to pay just to try it. Holm fit the bill and in the beginning was well supported. The single array export was done at my request. But now Holm is not supported at all and that worries me. I would rather use a software that is supported and I know will not just go away some day. But the software does have to export unmodified impulse responses as an array in a single file or it is just too hard to deal with.
An example export is available on my website.
I can't see ARTA or REW ever doing this.
But the software does have to export unmodified impulse responses as an array in a single file or it is just too hard to deal with.
An example export is available on my website.
I can't see ARTA or REW ever doing this.
That's my main problem with ARTA. It's a pain saving each individual impulse. REW can but unfortunately it's only for its own file type.
When I get a chance in the next couple days (maybe today) I'll send you my data.
- Status
- This old topic is closed. If you want to reopen this topic, contact a moderator using the "Report Post" button.
- Home
- Loudspeakers
- Multi-Way
- Measurement technology