I see nothing in that Holm file. It should be megabytes in size.
This is hopefully better:
One.com File Manager
This would be an error with my technique. You should rotate about the center of the enclosure. What is assumed is a source in an enclosure and the origin of the coordinate system is the center of the enclosure. The so-called "acoustic center" does not even enter into my calculations.
But as I say, I need an estimate of the box volume, source radius, speaker f0 and Q. Otherwise the results won't be as accurate.
My ceiling is about 4 meters. This is on the large side, yes, but not all that uncommon.
My point would be that I can get good results even in a room as small as yours - if you take the right data.
Box volume is around 100l with no stuffing. All box walls are lined with 5 cm basotect, rest of box is filled with open cell foam of 30PPI .
Drives fs is 38 Hz, speaker f0 is 50 Hz. Speaker has a calculated Qtc (using WinISD) of 0.41. Source radius, if you mean size of driver, is 6" (12" diameter driver).
How high are the typical ceiling in the USA? Here in Belgium the ceiling is typically at 2.5m height, so when the center of the speaker is at 1.25m, the first reflection (actually the first 2 reflections) for a measurement at 1.5m distance is will come after 4.15ms (or did I miscalculate this?).
Doing the reverse calculation, for a first reflection at 4.5 ms, I probably measuremed only at 1.25m distance.
The only way I can make the reflection free window larger, is to go outside. But with a complete active setup and a non-portable measurment pc, this is a task I like to avoid...
I looking at the time differce between the direct sound and the first reflection in ARTA, and this was 4.17 ms to be exact => doing the reverse calculation to determine measurement distance resulted in 1.47m.
Hi GedLee,
I have tried to understand the meaning of this post. After I reading almost everything I stopped at post no. 79. Do I understand it right, is it your goal to create a correct polarmap from as little measuring data as possible?
If so, I wonder why? As far as I remember my studies, it said: If you can measure something quick and easy, then do not use statistics or other tools.
With tools such as the turntable of Wim this is done quickly, even with a very high angular resolution.
So when you need to be sure .....
Regards
Heinrich
Hi Wim,
I think that's wishful thinking. If you have low resolution in the mentioned frequency range due to narrow windowing , then you can't make a high resolution polarmap from it.
Regards
Heinrich
That this is simply not true is the point. My technique solves three problems:
1) limited angular resolution with limited points - I can do with 14 points what it takes another technique 90 points to do (up to 10 kHz.)
2) near field effects are eliminated
3) LFs are enhanced to better represent reality.
I also want a common platform from which to view a database of designs.
If none of this interests you then you would have no interest in this experiment.
Hi GedLee ,
yes your last sentence is absolutely correct. I am not really interested in scientifically dressed baubles.
If I want to know how something works, I do my measurements in anechoic room or outdoors - and in this case with high angular resolution.
All the best for your experiments
Heinrich
yes your last sentence is absolutely correct. I am not really interested in scientifically dressed baubles.
If I want to know how something works, I do my measurements in anechoic room or outdoors - and in this case with high angular resolution.
All the best for your experiments
Heinrich
How many measurements would you need to get an accurate polar map up to say 15kHz, or even 20kHz?
It works at 15 kHz and 20 kHz, but there are situations that could be problematic - like the extreme example shown previously of simulated data. A pencil thin directivity at 13 kHz will alias. But a normal directivity at this same frequency, one that does not contain very high spatial frequencies, will not have much of a problem. The example shown before was a worse case that one would never see in practice - it was simulated data. At these frequencies a real source would not be rigid and the polar response would never be so narrow, so what we saw there would not happen.
Hi GedLee ,
yes your last sentence is absolutely correct. I am not really interested in scientifically dressed baubles.
If I want to know how something works, I do my measurements in anechoic room or outdoors - and in this case with high angular resolution.
All the best for your experiments
Heinrich
Wow, are you missing the point.
We are not discussing the very best way to measure a speaker where cost is no object - this is DIY!!! We are talking about how to get extremely good data at almost no cost thus making this applicable to all so that a database of designs could be accumulated.
Go waste your money on renting or building an anechoic chamber if that makes you happy.
Of course there is interest.
The real step forward would be if people who have brand name speakers would measure them and send the measurements to you. That would establish the database with high resolution measurements that are not provided by manufacturers. But i think that there's not going to be much of that because the people that buy factory made speakers rarely measure them. If they eventually buy measuring equipment then they measure their loudspeakers and in many cases sell them very fast. After that they usually make their own loudspeakers that suits their taste. There are exceptions but most of it comes to that.
As for me, when i set the xover right and make the measurements for my threeway i will send them to you and i'll open a thread with xover schematic, drivers list and measurements posted for those interested in building it - if any. DIY-ers will probably send the measurements to you because of curiosity, guys that spend lots of money on factory made speakers - not likely.
The database that consists mostly of DIY loudspeakers will be useful to determine what topology works good or bad and what are the advantages or drawbacks of it. It can serve well as an argument in some technical disputes but it will not shed any light to actual performance of the stuff that is being sold today and presented as high end.
Last edited:
Yes, there is certainly interest, especially if also well-known commercial speakers were added the database. I was for example very supprised to see how rough the polar of the quad ESL-57 was, because this is a fantastic sounding speaker, even by today standards. So if we could add Genelecs, JBLs, Zingalis... we could finally maybe all agree on what is really important.
But to do this, it would be great if your database also made the raw data available to others, because maybe we need to compare more than the polar plot alone...
But to do this, it would be great if your database also made the raw data available to others, because maybe we need to compare more than the polar plot alone...
This is hopefully better:
One.com File Manager
The data at 80 degrees and beyond is exactly what I said - the time base was not locked and Holm grabbed the reflection as the first arrival signal. It is obvious in the Holm data set.
Users would be wise to carefully read the procedure. the problems caused by not locking the time base can be significant.
I believe that you must also set "Keep in/out stream active" for this lock to work. If the stream is started anew each run then locking won't work. Sorry if I did not mention this before, but I have always had the stream set active, so I didn't think about it. I don't even know why it is an option.
Looking at the Holm data before you send it is always a good idea. If the impulses do not slowly retard in time then something is wrong. The frequency responses should not change abruptly either as this is a strong indication that something is wrong.
Last edited:
The data at 80 degrees and beyond is exactly what I said - the time base was not locked and Holm grabbed the reflection as the first arrival signal. It is obvious in the Holm data set.
Users would be wise to carefully read the procedure. the problems caused by not locking the time base can be significant.
I believe that you must also set "Keep in/out stream active" for this lock to work. If the stream is started anew each run then locking won't work. Sorry if I did not mention this before, but I have always had the stream set active, so I didn't think about it. I don't even know why it is an option.
Looking at the Holm data before you send it is always a good idea. If the impulses do not slowly retard in time then something is wrong. The frequency responses should not change abruptly either as this is a strong indication that something is wrong.
Ok, I thought with “locked” you actually meant "Keep in/out stream active", and this is what I have done. I did read your instructions, but for users who never work with holm, the brief instructions might not always be clear enough (or at least for me anyway)
So, to be sure were are talking about the same "locking" now:
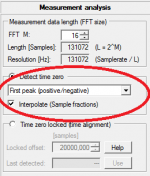
- first measurement (at zero degrees) should have "detect time zero" enabled (see pic)
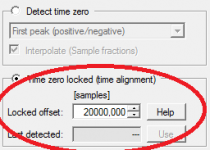
- after the first measurement is completed, I should select "time zero locked (time alignment)" and use the "last detected offset" by clicking the “use” button
- all following measurements should be taken like this
Is this correct?
Attachments
...I was for example very supprised to see how rough the polar of the quad ESL-57 was, because this is a fantastic sounding speaker, even by today standards.
I agree...it is rather surprising considering the apparent effort put into increasing the source size with falling frequency.
At one time they had mentioned that the ESL-63 polar would be added to their web page.
That would have been very interesting to see as well.
- Status
- This old topic is closed. If you want to reopen this topic, contact a moderator using the "Report Post" button.
- Home
- Loudspeakers
- Multi-Way
- Measurement technology