Inroom measurements with long gate show room reflections and modes. Here is link to my post of AINOgradient's room response done by moving the mic 3D around "sweet spot" Some are from floor level. I show also series with movement in only 1 out of 3 dimensions.
When we study a speaker's sound radiation/dispersion, 3D measurements are also important. The AES has a group of people trying to find a standard for these measurements, chairman is Dr. Klippel I think. I didn't find a link but it must be somewhere here AES Standards There is also a 3D sound analysis project at Aalto University Finland https://mediatech.aalto.fi/en/research/virtual-acoustics
When we study a speaker's sound radiation/dispersion, 3D measurements are also important. The AES has a group of people trying to find a standard for these measurements, chairman is Dr. Klippel I think. I didn't find a link but it must be somewhere here AES Standards There is also a 3D sound analysis project at Aalto University Finland https://mediatech.aalto.fi/en/research/virtual-acoustics
In my experience, averaging amplitude responses in a room works well.
With a 1/20th octave frequency smoothing, curves, above transition frequency, most curves lay in a range of +-6dB centered onto something like PER (predicted-with-early-reflections, as defined by Toole) .
Averaging 32 measurements, the variance should be divided by about 5.8 (squareroot of 32) and the average should stay within a +-1dB range, this is needed if the average is to be used as a base for EQ.
You may check validity of this procedure by doing two or more random sets of measurements : you allways end up with averaged curve very near one from another.
To get a random set of measurements, you need to be random in x, y but also z (height) positions and not forget to keep enough distance between two points.
About randomness of reflections : the very early ones near speakers are not random, and will not be averaged out, this is a good thing because those reflections are the ones that we are the most sensitive to. Late reflections are random and averaged out when doing multiple measurements.
I have compared many in-room and anechoic measurements of same speakers : correlation is generally quite good.
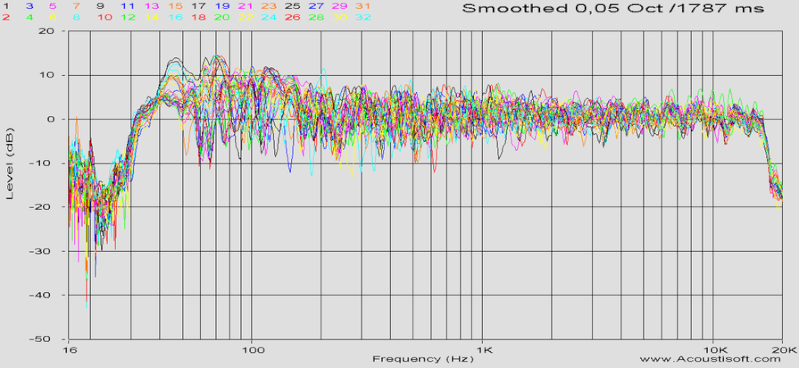
Hereunder is a set of 32 measurements (within a cone of about 10°) of a two ways horn loudspeaker in a small mixing room (100cubic meters).
The complete set of 32 random measurements
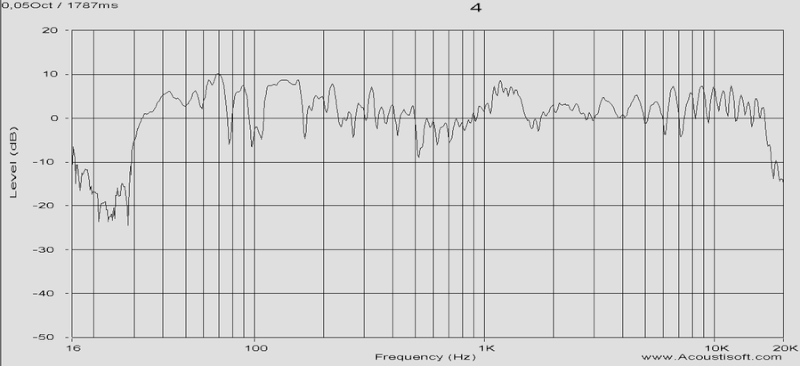
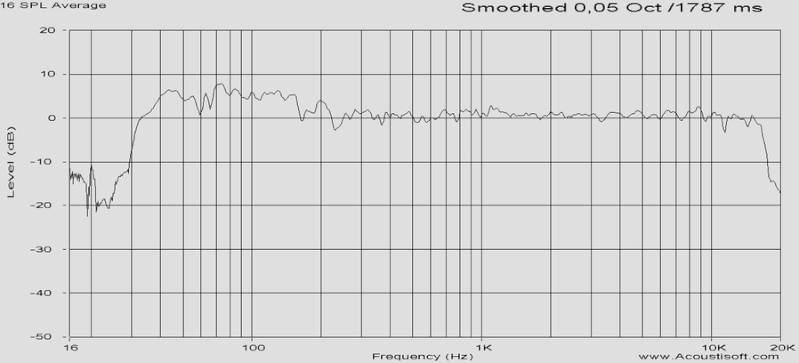
As a typical exemple, curve 4, one of worst !
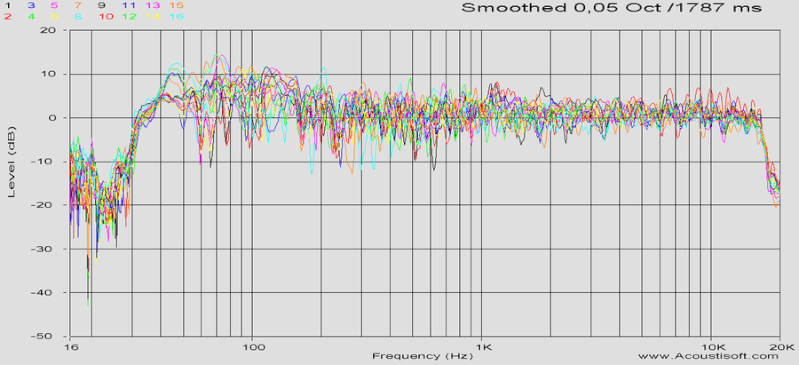
First half set (even measurements)
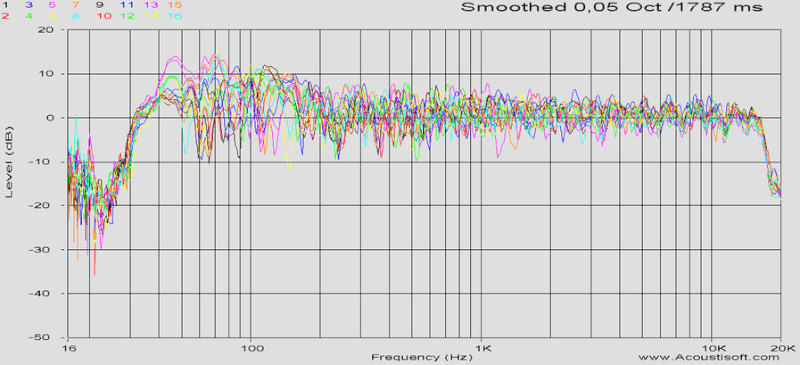
Second half set (odd measurements)
Average of 32

Average of first set
Average of second set

If someone wants to check, I can send this whole set of measured IRs.
With a 1/20th octave frequency smoothing, curves, above transition frequency, most curves lay in a range of +-6dB centered onto something like PER (predicted-with-early-reflections, as defined by Toole) .
Averaging 32 measurements, the variance should be divided by about 5.8 (squareroot of 32) and the average should stay within a +-1dB range, this is needed if the average is to be used as a base for EQ.
You may check validity of this procedure by doing two or more random sets of measurements : you allways end up with averaged curve very near one from another.
To get a random set of measurements, you need to be random in x, y but also z (height) positions and not forget to keep enough distance between two points.
About randomness of reflections : the very early ones near speakers are not random, and will not be averaged out, this is a good thing because those reflections are the ones that we are the most sensitive to. Late reflections are random and averaged out when doing multiple measurements.
I have compared many in-room and anechoic measurements of same speakers : correlation is generally quite good.
Hereunder is a set of 32 measurements (within a cone of about 10°) of a two ways horn loudspeaker in a small mixing room (100cubic meters).
The complete set of 32 random measurements
As a typical exemple, curve 4, one of worst !
First half set (even measurements)
Second half set (odd measurements)
Average of 32
Average of first set
Average of second set
If someone wants to check, I can send this whole set of measured IRs.
Last edited:
I use a lazy man's version of the averaging scheme. I set my analyzer to average 32 spectra of about 1 second each, send pink noise to the speaker being tested, and leave the pan and tilt on my 3 foot long microphone boom unlocked. I then sweep my measurement mic through a horizontal and vertical raster pattern about 1 foot by 1 foot at my listening position as data is being taken. I can't defend the accuracy of the procedure, but it does give very repeatable spectra and the resulting equalization sounds quite good to me.In my experience, averaging amplitude responses in a room works well.
It is better to do your measurements over a much wider space : I would recommend to widen to about 1/5th of your listening room. So you will randomize down to transition (Schroeder) frequency.I then sweep my measurement mic through a horizontal and vertical raster pattern about 1 foot by 1 foot at my listening position
- Status
- This old topic is closed. If you want to reopen this topic, contact a moderator using the "Report Post" button.