fluid,
I'm not sure your explanation of the reason for that area between 600-1K is correct as it isn't causing the same response below those frequencies? As far as I remember doing waterfalls the windowing was scaled for frequency and shifting in time as the frequency increases. There was no having to make multiple response curves and having to stitch them together, it was a simple log chirp impulse in my Clio system.
I'm not sure your explanation of the reason for that area between 600-1K is correct as it isn't causing the same response below those frequencies? As far as I remember doing waterfalls the windowing was scaled for frequency and shifting in time as the frequency increases. There was no having to make multiple response curves and having to stitch them together, it was a simple log chirp impulse in my Clio system.
I wonder which is more "correct" then
It would in the vertical direction that I would expect the multiway changes more. Byrtt has shown before that by using very steep filters a multiway can get more even vertical response too. Probably not much of an issue if you always listen at the same height.
In my system I have found that using a spatially averaged measurement across my couch in a similar way that SwissBear has written about here before is very useful to base a correction on. On a single measurement I would need to use significantly weaker correction to avoid it sounding "processed". I tested the same strong correction with a single measurement as the base and it was terrible.
My room is quite reflective and has zero treatment so in a treated room the differences might be less.
Hi fluid, my limited understanding is based on this research on acoustics and psychoacoustics of room correction: AES PNW Meeting Report - Acoustic and Psychoacoustic Issues in Room Correction The frequency dependent windowing is the acoustics part of letting in how much room sound relative to direct sound. The psychoacoustic part is an overall fixed filter applied to best represent what our ears hear in small room acoustics. My understanding is that for room correction, both FDW and psychoacoustic filtering are required to best represent what we hear. In the case of the software I use, the psychoacoustic filter is proprietary and different from REW's.
I have tried a variation of the spatially averaged measurements using a beamforming method: Quasi-Anechoic Measurement of Loudspeakers Using Beamforming Method (PDF Download Available) I got similar results to these published and does sound different. Does the spatially averaged technique you are mentioning produce similar results as in the linked article?
fluid,
I'm not sure your explanation of the reason for that area between 600-1K is correct as it isn't causing the same response below those frequencies? As far as I remember doing waterfalls the windowing was scaled for frequency and shifting in time as the frequency increases. There was no having to make multiple response curves and having to stitch them together, it was a simple log chirp impulse in my Clio system.
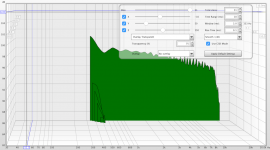
CLIO is different to REW and the window settings wesayso has used are causing what you see, I have not found a setting in REW that gives a similar type of response that CLIO etc. do when looking at the whole frequency range.
Here is the rest of the graph that you don't see in the screen shot from one of my measurements using the same window settings. See how the response ends at 333Hz which corresponds to the window setting, make sense now?
If you don't use REW and haven't looked at the manual section on waterfalls then I can understand your confusion.
Attachments
Rephase is a tool, and exactly as mathematics, it is extremely tricky to get it totally pertinent and totally true or By abusing of 2D graphs and mathematical abstractions but I don't think that's entirely fair to those of us that literary have spend years to figure out what works and what doesn't. I try and share to possibly help others and I learn from the generous sharing of others.
My remark was about those who lack of rigor when they use such tools.
Show one global 20-20K FR or CSD graph d'ont tell anything about the linearity of the acoustic power rendering in a small room, there is some room mode at some measuring points of the room that gives you perfect CSD and FR graphs without any direct signal coming from the loudspeakers.
The time alignment listening window can be quite large for multiway's as well. Here is the step response of the same active 3-way I posted earlier, except I took 14 measures of both left and right speakers over a 6' x 2' grid which covers my couch area at the LP:
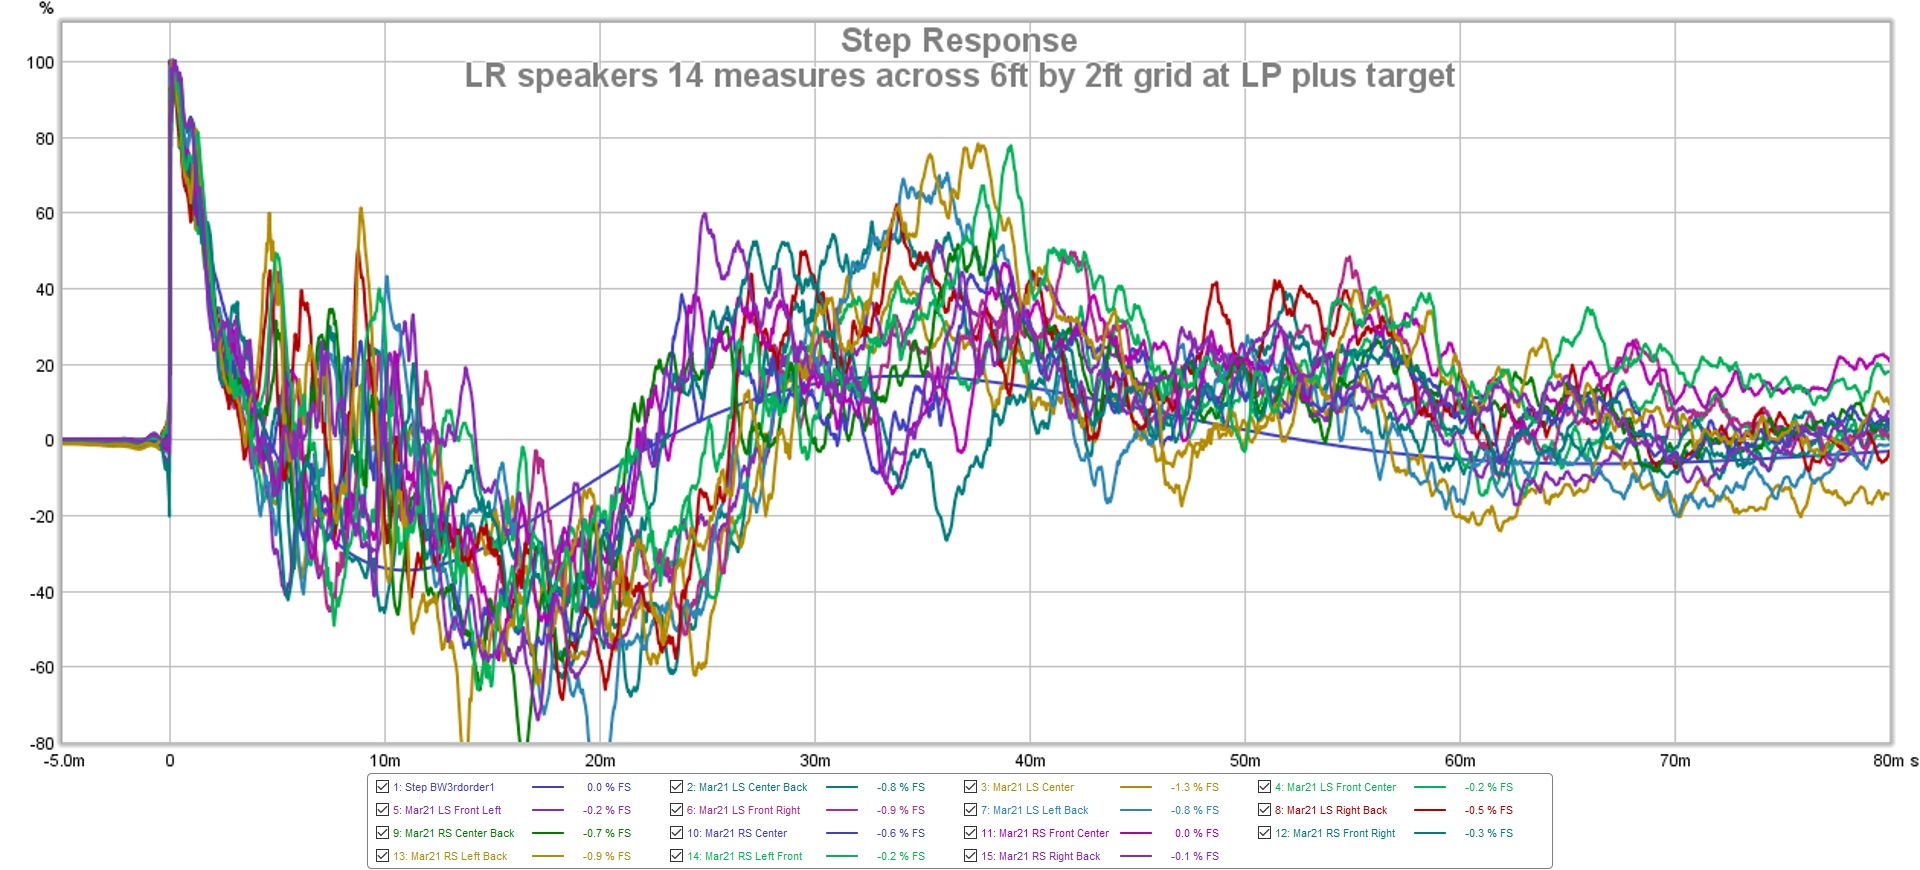
The drivers are time aligned over the 6' x 2' listening area as indicated by the vertical "step" overlay at t=0. Moving the height of the mic up and down by a foot each way, produces similar results. I have overlaid the "ideal" step response as well. The peaks at 4ms and 8ms are the bounce off the rear wall from the measurements that were taken near the back of the couch area. i.e. the mic is (much) closer in distance to the rear wall versus the distance to the speaker.
Thank you for this measurement(s). It shows very well how the visuals of the time response measurements changes quite a lot inside the sweet spot. The sound is NOT perceived as very different inside the listening area, I guess.
As of the claimed progress using correction and linearray.
The implication is that:
Tweeter quality don't matter it can just be corrected.
Large cone movement don't matter for HF.
Output on the low side of speaker element Fs don't matter.
Combfiltering at HF can be corrected (without individual speaker element prosessing) to become a time coherent system at all frequencies and large sweetspot
This is not just progress it is an revolution or paradigma shift. So it's no wonder we want hard evidence for such claims")
The implication is that:
Tweeter quality don't matter it can just be corrected.
Large cone movement don't matter for HF.
Output on the low side of speaker element Fs don't matter.
Combfiltering at HF can be corrected (without individual speaker element prosessing) to become a time coherent system at all frequencies and large sweetspot
This is not just progress it is an revolution or paradigma shift. So it's no wonder we want hard evidence for such claims
Not what I would suggest although there is a lot of anecdotal evidence that if equalized to the same target it is hard to tell much difference.As of the claimed progress using correction and linearray.
The implication is that:
Tweeter quality don't matter it can just be corrected.
Not the implicationLarge cone movement don't matter for HF.
Kind of if you have enough cones to spread the load it matters much less than with a single speaker.Output on the low side of speaker element Fs don't matter.
Comb filtering at high frequencies in a room at a reasonable listening distance is virtually inaudible so it doesn't really need correcting.Combfiltering at HF can be corrected (without individual speaker element prosessing) to become a time coherent system at all frequencies and large sweetspot
This is not just progress it is an revolution or paradigma shift. So it's no wonder we want hard evidence for such claims
No it is just a good balance of things in a speaker that matter and work well vs some that don't matter as much.
I would kindly ask (again) that if you want to continue the debate of line arrays that you do it on one of the dedicated threads rather than clog up this one.
I have tried a variation of the spatially averaged measurements using a beamforming method: Quasi-Anechoic Measurement of Loudspeakers Using Beamforming Method (PDF Download Available) I got similar results to these published and does sound different. Does the spatially averaged technique you are mentioning produce similar results as in the linked article?
Hi Mitch, yes I did find the same result. It really works to reduce the amount of room influence in the measurement. It keeps the issues that are not position specific. The more measurements you use to average the more the room is suppressed. I have settled on Centre, 10, 30 and 50cm either side at ear level as being a good balance between room suppression and the time it takes to do the measurements. My first test had 22 in total and it took most of the day to do.
I posted an ETC on my thread here that shows the reduction quite clearly
Full Range TC9 Line Array CNC Cabinet
reduce the amount of room influence in the measurement
IMHO, It should be interesting to quantify the reduction of room influence.
Well just provide some counter arguments why arrays not nesecarily is better than multiway. We are in the multiway section
Line arrays talked about do XO to each other and are indeed multiple ways aren't they
IMHO, It should be interesting to quantify the reduction of room influence.
Look at the big reflections sticking out at 4.5ms and just before 10ms in the first graph. The one at 4.5ms has gone from -14dB to about -30dB in the second graph. Comparisons to outdoor measurements in both to make it clearer.
Look at the big reflections sticking out at 4.5ms and just before 10ms in the first graph. The one at 4.5ms has gone from -14dB to about -30dB in the second graph. Comparisons to outdoor measurements in both to make it clearer.
Not bad, could you filter it at 60Hz or 100Hz ?
Line arrays talked about do XO to each other and are indeed multiple ways aren't they
Hm, I'm confused. This is multiway, but I should discuss it in the full-range section
Actually the 100 Hz XO question a few days ago is an interesting topic. Will the sound from two arrays sum as an coax if LF and HF array is placed in same heighth. So you don't really need LR filter because there is no LF/HF pathlength difference going up or down in in listening heigth
Filtered wave shapes... using the filtered IR tab in REW, set to its max resolution of 1/3 octave. Shown result is the impulse tab.
Red = corrected stereo impulse, green is the generated Rephase equivalent.
63 Hz (because it's available as filter setting in REW)

Moving up to midrange, 4 KHz, same story, red is corrected result, green IR from Rephase:

Doing something a little more difficult, 8 KHz:

Any other volunteers showing their IR results at the listening position? About 3 m from the array, optimized with DRC-FIR and REW.
If we want to take this further about arrays etc, lets move into an array thread, mine will do, you're welcome. Lets keep this thread about RePhase and the many uses it has for us as a learning tool, correction tool and what ever other use it might have for us.
Red = corrected stereo impulse, green is the generated Rephase equivalent.
63 Hz (because it's available as filter setting in REW)
Moving up to midrange, 4 KHz, same story, red is corrected result, green IR from Rephase:
Doing something a little more difficult, 8 KHz:
Any other volunteers showing their IR results at the listening position? About 3 m from the array, optimized with DRC-FIR and REW.
If we want to take this further about arrays etc, lets move into an array thread, mine will do, you're welcome. Lets keep this thread about RePhase and the many uses it has for us as a learning tool, correction tool and what ever other use it might have for us.
Last edited:
Thank you for this measurement(s). It shows very well how the visuals of the time response measurements changes quite a lot inside the sweet spot. The sound is NOT perceived as very different inside the listening area, I guess.
Yes, if you read the linked paper from JJ on acoustics and psychoacoustics, it is the first arrival timbre that our ears care about most. As can be seen from the step response chart, the first arrival of sound at t=0 is indeed the same around a 6' x 2' grid area. After the driect sound, it does vary somewhat after that, but is not perceived as tonal change as per JJ's (and Toole's) research. I could show the same chart of 14 measures of the frequency response and one can see that it is virtually the same tonal response across the 6' x 2' listening area, but this thread is about rePhase.
Hi Mitch, yes I did find the same result. It really works to reduce the amount of room influence in the measurement. It keeps the issues that are not position specific. The more measurements you use to average the more the room is suppressed. I have settled on Centre, 10, 30 and 50cm either side at ear level as being a good balance between room suppression and the time it takes to do the measurements. My first test had 22 in total and it took most of the day to do.
I posted an ETC on my thread here that shows the reduction quite clearly
Full Range TC9 Line Array CNC Cabinet
Hi fluid, cool. Yes, I did similar using the beamforming technique and moved the mic in 10 cm increments moving forward and back from the LP for 10 measurements in total. Does do a great job of suppressing the room and have similar ETC's like yours. Still considering if I like the sound versus a single measure. Some say that the multiple measurements also helps average the low frequency response and others say that for some DSP correction software, the averaging is built-in to the psychoacoustic filter...
Don't worry about clipping in programs like Audacity or Goldwave until you export into a PCM format. These programs work in float bit space, so there is no clipping. You'll see it indicated because it would clip if exported in a non-float format.... and before process had to lower track level in Audacity by 6dB else processing would show red overloads in Audacity window, which in a way scare me and makes me think i wanna start my first point in DSP engine by lowering level by 6dB...
Just normalize before exporting to normal 16 or 24 bit formats. JRiver does it's DSP in 64 bit float, so no clipping there until you send it out to the DAC in PCM. That you do have to be aware of.
Help Please
Hi,
Everyone I am new to using the rePhase software for the first time. I will outline what I have and generated and many questions to ask but limit to asking what I need to know first.
Speakers: 2 way open baffle(similar to LX Mini, cross at 750Hz)
Equipment: MinidspHD 2*4 way
Software:REW via Umik and Rephase
I generated a x-over at 750Hz Using LR 2nd order, then I used the REW to equalise the output to relatively flat. I downloaded to Rephase software and was I unable(due lack of knowledge of rePhase) to make the phase flat. Attached is my freq response and phase outputs, I would appreciate for advice on how to make the phase as flat as possible.
Questions:
1. the Rephase sequence/steps I should be considering to equalise the phase for any output response?
2. What curve smoothing should I use normally?
Rephase is a powerful software and maybe due to lack of documentation(text and video) I cannot really get a full understanding on how to to use it effectively.
ANY help is welcomed, thanks.
Attachments
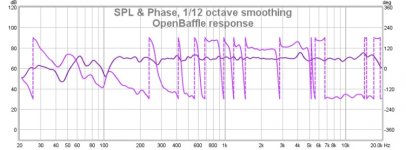
Phase from an in room measurement will be a mess and you cannot flatten it or nor do you want to.
Try using a Frequency Dependent Window on the measurement the phase will look a lot cleaner. Go to IR Windows tab tick Add Frequency dependent window and then select the amount of cycles. 6 to 15 cycles will probably be best.
To undo the phase turn from the second order filters you can go into the Filters linearization tab in rephase select LR 12dB and your crossover frequency.
To remove the excess phase use a 6 cycle Frequency dependent window on the measurement and generate an excess phase version in REW from the all spl tab controls. Save that measurement as text, import the measurement into rephase and use the paragraphic phase EQ to make the phase closer to 0 avoid trying to get rid of the big jumps in phase because they will be due to reflections. Generate a filter as a wav file at 32 bit and load that into a convolver to test if you use a computer as a source, I can't help you with the best way to get that filter into a minidsp as I have never used one.
Swiss Bear wrote a tutorial linked somewhere in this thread search for his posts if you want to see some screenshots.
- Home
- Design & Build
- Software Tools
- rePhase, a loudspeaker phase linearization, EQ and FIR filtering tool