I was wondering, is there a way to setup a group of settings profile, including instrument layout, so that we can call up any specific profile for a test without doing setup from scratch?
Also, I would a predicate push update notifications to keep up to date on MI Pro software revisions, is this possible?
Also, I would a predicate push update notifications to keep up to date on MI Pro software revisions, is this possible?
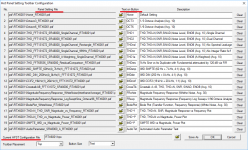
The third toolbar from the top is user configurable. It is called “Hot Panel Setting Toolbar” consisting of 20 user configurable buttons. You can configure this toolbar via [Setting]>[Configure Hot Panel Setting Toolbar]. Each button can be assigned a Panel Setting File and a label. When clicked, it will load that Panel Setting File. The entire toolbar configuration can be saved as a *.hps file. (See attached).
A Panel Setting File can be saved via [Setting]>[Save Current Panel Setting]. It contains sampling, processing and analysis settings as well as the layout information.
Software update notification will be included in the future. Thanks for the suggestion.
A Panel Setting File can be saved via [Setting]>[Save Current Panel Setting]. It contains sampling, processing and analysis settings as well as the layout information.
Software update notification will be included in the future. Thanks for the suggestion.
Attachments
One confusing aspect of the configurations is the flexibility of hardware setup. It seems very versatile but that stops for ASIO/Win sound. I would like to have several stored configurations with the details preset (my primary system has 4 soundcards) so switching sources and ADC's is less error prone.
Another feature that I would like would be the ability to send GPIB commands to external sources and maybe analyzers. I have GPIB oscillators with much lower distortion than any soundcard that would be nice to integrate. Usually the commands for those are really simple (XXXHz and XXXmV) so linking them for a distortion sweep would be useful.
Another feature that I would like would be the ability to send GPIB commands to external sources and maybe analyzers. I have GPIB oscillators with much lower distortion than any soundcard that would be nice to integrate. Usually the commands for those are really simple (XXXHz and XXXmV) so linking them for a distortion sweep would be useful.
Hi lemon,
I wouldn't worry about software updates. Virtins will update their own software when it is appropriate to do so. This would probably involve a group of new features or something like that. They have made the RTX (now Virtins)-6001 native to their code, and that is a massive help to everyone. You no longer treat the 6001 as a sound card. It's now more about the software. Updates may coincide with their own update path rather than the 6001 pushing them.
Personally, I am very happy to see stable software without many updates. Windows changes more than enough for me, let the application remain stable.
All in all, Virtins has really stepped up to the plate here. I am very grateful they have done what they have so far.
-Chris
Hi Lemon,
We are still developing MI 3.9. We want to add more features to qualify the new release as a major upgrade. It should be released before the end of this year.
By the way, RTX6001 hardware unit is out of stock as RTX has discontinued it, but MI will keep moving forward for sure")
Thank you all for your patience and support!
We are still developing MI 3.9. We want to add more features to qualify the new release as a major upgrade. It should be released before the end of this year.
By the way, RTX6001 hardware unit is out of stock as RTX has discontinued it, but MI will keep moving forward for sure
Thank you all for your patience and support!
@Virtins,
I wish to use my RTX6001/MI Pro to measure outputs from my USB only dac. I assume that I need to generate a WAV file of the test signals to be used, properly dithered, set at an appropriate volume (-3dB) et cetera. Is MI Pro able to do this?
Although I have used RTX/MIpro to measure input and output impedances, some basic SNR/THD etc. of items with analogue inputs, I would much appreciate some hand-holding to enable me to measure items with digital inputs such as dacs. Is there a tutorial somewhere that would be of use?
Anthony
Hi Anthony,
Thank you for your questions. With MI Pro, you can measure the output from your USB DAC using RTX6001 directly without using wave files as the transfer medium. You can go to [Setting]>[ADC Device] and select “RTX6001 ASIO” or “RTX6001 MME” in Device Model selection box. Then go to [Setting]>[DAC Device] and select “Sound Card ASIO” or “Sound Card MME” in Device Model selection box and your USB DAC in Device No. selection box. Test signals can be generated directly from the signal generator panel of MI. In case you need to dither the test signal, you can generate the test signal using the MultiTones function with a certain amount of white noise added there.
Thank you for your questions. With MI Pro, you can measure the output from your USB DAC using RTX6001 directly without using wave files as the transfer medium. You can go to [Setting]>[ADC Device] and select “RTX6001 ASIO” or “RTX6001 MME” in Device Model selection box. Then go to [Setting]>[DAC Device] and select “Sound Card ASIO” or “Sound Card MME” in Device Model selection box and your USB DAC in Device No. selection box. Test signals can be generated directly from the signal generator panel of MI. In case you need to dither the test signal, you can generate the test signal using the MultiTones function with a certain amount of white noise added there.
Thanks Virtins,
That makes perfect sense, don't know why I did not think of that myself.
In a similar application, I am hoping to measure the effect of software upsampling and digital filters on the outputs of a non-oversampling dac, namely SNR, THD et cetera, with upsampling up to x16 and sample rates up to 32/705kHz and 32/768kHz. Can you think of a way to do this with MIpro/RTX6001? I don't think the SignGen in MIpro will output at these rates so perhaps I will need to use standard 16/44.1kHz files and run them through upsampling software such as HQPlayer or XXHighEnd, especially if I want to see how the different digital filters manipulate the THD.
Anthony
To measure the effect of software upsampling and digital filters on the SNR and THD etc., you can use an upsampling software to create the upsampled and filtered WAV file first, then in Multi-Instrument, use [File]>[Open] to load that file, and set the analysis parameters properly to measure the SNR and THD, etc. WAV files with any sampling rate are supported.
For real-time sampling, currently the listed sampling rates for Sound Card MME and ASIO drivers in Multi-Instrument are: 2k,4k,8k,11.025k,16k,22.05k,32k,44.1k,48k,64k,88.2k,96k,176.4k,192k,384k,768k. In case your ADC or DAC hardware supports a different sampling rate than the above listed ones, then you can use a plain text editor such as Windows Notepad to open the ADC device database configuration text file “ADCDevice.ddb” or DAC device database configuration text file “DACDevice.ddb” in the root directory of Multi-Instrument, and add your very own sampling rate there. Then that sampling rate will be available for selection in Multi-Instrument.
For real-time sampling, currently the listed sampling rates for Sound Card MME and ASIO drivers in Multi-Instrument are: 2k,4k,8k,11.025k,16k,22.05k,32k,44.1k,48k,64k,88.2k,96k,176.4k,192k,384k,768k. In case your ADC or DAC hardware supports a different sampling rate than the above listed ones, then you can use a plain text editor such as Windows Notepad to open the ADC device database configuration text file “ADCDevice.ddb” or DAC device database configuration text file “DACDevice.ddb” in the root directory of Multi-Instrument, and add your very own sampling rate there. Then that sampling rate will be available for selection in Multi-Instrument.
Some news for the MI 3.9 release?
The development of MI 3.9 has been done. But we have not completed the documentation yet. Looks like it will take three more weeks or so. The following are some screenshots showing a few new functions out of many others for preview. Just to show that we are really working hard on it
. Thank you all for your patience and interest in MI 3.9.1.Reverberation Analysis via Interrupted Noise

2.Reverberation Analysis via Integrated Impulse Response

3.Reberberation & Speech Intelligibility Analysis Results

4.Discontinuity (Abruptness) Detection

Has this Group Buy closed? I have an RTX6001 and am considering getting the Virtins Pro package.
Jan
Hi Jan, yes it has been closed. but you can purchase it on our website. Thanks.
MI Pro v3.9 Build 1, Released 22 Apr 2020 - - Free Update!
Newest version of MI Pro just released 22 Apr 2020, all existing users get it for free at this URL:
Downloads - PC Sound Card Oscilloscope, Spectrum Analyzer, Signal Generator, Data Logger, Real Time Audio Analyzer | Virtins Technology
Please check out the below release notes to see all the new measurements / features added and other changes (there are many!!!
Multi-Instrument Release Notes
 Version 3.9 Build 1, Released on Apr 22, 2020
[+] If the software is installed into the same directory of an old installation without performing uninstallation first, the old configuration such as the color scheme and calibration data, etc. will be inherited. It is also possible for a brand-new installation to inherit an old configuration if the old configuration file Scins.cfg is renamed to Scins.cfg.old and put under the new installation directory before the very first run.
[+] Added SPA_THD() API in vtSPA.dll for THD, THD+N, SINAD and SNR calculation for software development.
[+] Added sample codes for using vtSPA.dll in TestDAQ VC# project.
[+] Added sample codes for interfacing to VT IEPE-2G05 in TestDAQ VC++ and VC# projects and LabVIEW Projects.
[+] Added ActiveX automation client sample codes in Python.
[+] Allow Power Spectral Density (i.e. [Spectrum Analyzer Y Scale]>"Energy Per Hz") option even under octave band analysis mode.
[*] Reference Curves will be drawn as "Step" instead of "Line" when Chart Type is "Bar" or "Step".
[+] Added 1/1, 1/3, 1/6, 1/12, 1/24, 1/48, 1/96 octave smoothing options at [Spectrum Analyzer Processing]>"Intra-Frame Processing">"Smoothing via Moving Average". It is possible to specify a minimum number of points for octave smoothing which is useful for smoothing low frequency portion.
[+] In single-channel 1/1 or 1/3 octave analysis, if [Spectrum Analyzer Chart Option]>"Mark Peaks" is ticked and [Spectrum Analyzer Y Scale] is in dBV, dBu, dB or dBFS, the Y value of each octave band will be displayed as text as well in the spectrum graph. This would be convenient during EQ processes.
[*] Added 1dB, 2dB, 5dB, 10dB, 15dB, 20dB, 25dB, 30dB, 35dB, 40dB, 45dB, 60dB, 70dB, 80dB, 90dB, 120dB, 300dB, 350dB, 400dB, 450dB, 500dB options for dB scales of Y axis in Spectrum Analyzer and Spectrum 3D Plot.
[*] Engineering units are added in the Y axis display range options in Oscilloscope, Spectrum Analyzer and Spectrum 3D Plot View Parameter ToolBars.
[*] When [Oscilloscope Processing]>"Digital Filtering">"Arbitrary">"IIR Coefficients" is selected, "FIR Delay Removal" will be unticked by default.
[+] Added DIM option in [Spectrum Analyzer Processing]>"Parameter Measurement">"IMD". The corresponding MultiTones configuration files for DIM30 and DIM100 test signal generation are also provided.
[*] Insert, Modify, Delete, Clear All steps in Device Test Plan will no more automatically close the opened X-Y Plots.
[+] Added [Sticky Move] option in the system menu of the main window of Device Test Plan. When selected, moving the title bar of Device Test Plan will move all its associated X-Y Plots together. This option is ticked by default. Similarly, added [Sticky Move] option in the system menu of the software's main window as well.
[+] Added "Frequency Response" options: White Noise, Pink Noise, Arbitrary under Automatic MultiTones Configuration mode of Signal Generator. It will generate FFT-bin-aligned multitones with the specified frequency response within the specified frequency range.
[+] Added "..." button beside "Mask" in Signal Generator. If clicked, Mask Configuration dialog box will pop up. It is now possible to specify a window function for the "On" duration and "Off/On Amplitude Ratio (dB)". This can be used to geneate various window gated output. By default, Rectangle window is used for "On" duration and zero is output during "Off" duration.
[*] When [Record Length]/[FFT Size] is less than 2 under Coherence Function mode in Spectrum Analyzer, a warning message will be displayed in the center of the Spectrum Analyzer window.
[*] Support Spectrum Analyzer's Inter-Frame Peak Hold or Linear Average for a specified number of frames in Instruction SIO in Device Test Plan when "No Trigger" is ticked.
[+] Added a DDP called NumberOfFrames to show the number of data frame acquired since the start of data acquisition.
[+] Added a DDP called OverallPassFailCheck to show overall Pass / Fail /Nil. If no alarm is configured in all DDP viewers, "Nil" will be displayed (=0). If any alarm is detected, "Fail" will be displayed (<0). If no alarm is detected, "Pass" will be displayed (>0).
[+] Added [Copy As Text] and [Export] options in the context menu of DDP Viewer.
[+] Added "+Reverse" option in Signal Generator to allow backward sweep after the forward sweep when "Loop" is ticked.
[+] Added Total Distortion and Noise (TD+N) option in [Spectrum Analyzer Processing]>"Parameter Measurement">"Peaks". If selected, the detected peaks will be considered as the multitone stimulus and the rest will be considered as the total distortion and noise. The corresponding DDPs are: TDN_A(%), TDN_A(dB), TDN_B(%), TDN_B(dB).
[+] Added Blackman Harris 7, Cosine Sum 220, Cosine Sum 233, Cosine Sum 246, Cosine Sum 261 window functions in Spectrum Analyzer. The corresponding 24-bit 1024-point wave files are also added in \wav\window subdirectory of the software for reference.
[*] Added "N" and "lbf" options in [Setting]>[Calibration]>"Sensor">"Unit".
[*] "-C-" will be displayed at the lower left corner of Spectrum Analyzer to indicate [Spectrum Analyzer Processing]>"Intra-Frame Processing">"Compensation1" or "Compensation2" is selected.
[*] Added 99.1%, 99.2%,...,99.9% options in Window Overlap Percentage in Spectrum Analyzer View Parameter Toolbar.
[*] Added grid and more axis labels in Spectrum 3D Plot for better quantitative view.
[+] Added [Spectrum 3D Plot Processing] tab.
[+] Added 1/1, 1/3, 1/6, 1/12, 1/24, 1/48, 1/96 Octave options for [Spectrum 3D Plot X Scale]
[+] Added [Spectrum 3D Plot Y Scale]>"Shift Display Range by (dB)" and now it is possible to zoom in/out along Y axes.
[+] Added [Spectrum 3D Plot Chart Options]>"Spectrogram">"Smoothing" option. It smooths the graph along both time and frequency axes through interpolation.
[+] Added Inter-Frame and Intra-Frame options in Spectrum 3D Plot View Parameter Toolbar. It is now possible to split one oscilloscope frame of data into multiple FFT segments and generate a Spectrum 3D Plot through the newly added Intra-frame option. Intra-frame mode supports two analysis modes: Short Time Fourier Transform (STFT) and Cumulative Spectral Decay (CSD).
[+] Added [Spectrum Analyzer Processing]>"Intra-Frame Processing">"Circular Correlation" option. If ticked, the Auto Correlation function and Cross Correlation function in Spectrum Analyzer will change from linear correlation to circular correlation. It can be used as one of the impulse response measurement methods.
[*] The two channels of data used in Cross Correlation computation in Spectrum Analyzer are swapped. When Cross Correlation function is used to obtain the impulse response, the stimulus should be in Ch. B and the response should be in Ch. A. This arrangement is now consistent with that of the Transfer Function measurement.
[*] The exported text files of Auto Correlation function, Cross Correlation function and Impulse Response in Spectrum Analyzer can now be imported via [File]>[Import].
[+] Added Derived Data Curves (DDC) button in the Instrument & Miscellaneous Toolbar. Maximum 8 DDC windows can be opened concurrently. The following DDCs are available:
(1) Energy Time Curve (Log-Squared)
(2) Energy Time Curve (Envelop)
(3) Energy Time Curve (dBSPL)
(4) Impulse Response Schroeder Integration Curve
(5) Step Response From Impulse Response Integration
(6) Frequency Time Curve
It is possible to apply a 1/1 octave filter from 63Hz to 8kHz or 1/3 octave filter from 50Hz to 10kHz to the time-domain data non-destructively before deriving the above DDCs.
[+] Added [Oscilloscope Processing]>[Parameter Measurement]>"Reverberation / Speech Intelligibility" option. If ticked, reverberation analysis according to ISO3382 and speech intelligibility analysis according to IEC 60268-16 will be performed. The analyses can be based on either 1/1 or 1/3 octave bands. Parameters that can be measured include Early Decay
Time (EDT), Reverberation Time RT60 (through T20 or T30), Clarity C50 and C80, Definition D50, Center Time Ts, Modulation Transfer Function (MTF), Articulation Loss of Consonants %ALcons and Speech Transmission Index (STI). The results are stored in DDP arrays: AcousticParameter_A_Array and AcousticParameter_B_Array. They can be viewed as a report through DDP Array Viewer:
(1) A-Reverberation / Speech Intelligibility (1/1 Octave)
(2) B-Reverberation / Speech Intelligibility (1/1 Octave)
(3) A-Reverberation / Speech Intelligibility (1/3 Octave)
(4) B-Reverberation / Speech Intelligibility (1/3 Octave)
[+] Added [Oscilloscope Processing]>[Parameter Measurement]>[Discontinuity] option. If ticked, the maximum waveform discontinuity value and its time of occurrence will be stored in DDPs:MaxDiscontinuityValue_A(%), MaxDiscontinuityTime_A(ms), MaxDiscontinuityValue_B(%) and MaxDiscontinuityTime_B(ms).
[*] "iB=oA" loopback mode of Signal Generator allows feeding a signal of more than 1s into Oscilloscope, in order to facilitate impulse response and transfer function measurements using single-channel mode.
[+] Added Panel Setting Files for ANSI/CEA-2010 subwoofer max. SPL test.
[+] Added Panel Setting Files for single-channel impulse response and transfer function measurements.
[+] "Copy As Text" and Export functions in Spectrum 3D Plot can export data in slices of time or slices of frequency. A pop up message will prompt for user selection.
Newest version of MI Pro just released 22 Apr 2020, all existing users get it for free at this URL:
Downloads - PC Sound Card Oscilloscope, Spectrum Analyzer, Signal Generator, Data Logger, Real Time Audio Analyzer | Virtins Technology
Please check out the below release notes to see all the new measurements / features added and other changes (there are many!!!
Multi-Instrument Release Notes
[+] If the software is installed into the same directory of an old installation without performing uninstallation first, the old configuration such as the color scheme and calibration data, etc. will be inherited. It is also possible for a brand-new installation to inherit an old configuration if the old configuration file Scins.cfg is renamed to Scins.cfg.old and put under the new installation directory before the very first run.
[+] Added SPA_THD() API in vtSPA.dll for THD, THD+N, SINAD and SNR calculation for software development.
[+] Added sample codes for using vtSPA.dll in TestDAQ VC# project.
[+] Added sample codes for interfacing to VT IEPE-2G05 in TestDAQ VC++ and VC# projects and LabVIEW Projects.
[+] Added ActiveX automation client sample codes in Python.
[+] Allow Power Spectral Density (i.e. [Spectrum Analyzer Y Scale]>"Energy Per Hz") option even under octave band analysis mode.
[*] Reference Curves will be drawn as "Step" instead of "Line" when Chart Type is "Bar" or "Step".
[+] Added 1/1, 1/3, 1/6, 1/12, 1/24, 1/48, 1/96 octave smoothing options at [Spectrum Analyzer Processing]>"Intra-Frame Processing">"Smoothing via Moving Average". It is possible to specify a minimum number of points for octave smoothing which is useful for smoothing low frequency portion.
[+] In single-channel 1/1 or 1/3 octave analysis, if [Spectrum Analyzer Chart Option]>"Mark Peaks" is ticked and [Spectrum Analyzer Y Scale] is in dBV, dBu, dB or dBFS, the Y value of each octave band will be displayed as text as well in the spectrum graph. This would be convenient during EQ processes.
[*] Added 1dB, 2dB, 5dB, 10dB, 15dB, 20dB, 25dB, 30dB, 35dB, 40dB, 45dB, 60dB, 70dB, 80dB, 90dB, 120dB, 300dB, 350dB, 400dB, 450dB, 500dB options for dB scales of Y axis in Spectrum Analyzer and Spectrum 3D Plot.
[*] Engineering units are added in the Y axis display range options in Oscilloscope, Spectrum Analyzer and Spectrum 3D Plot View Parameter ToolBars.
[*] When [Oscilloscope Processing]>"Digital Filtering">"Arbitrary">"IIR Coefficients" is selected, "FIR Delay Removal" will be unticked by default.
[+] Added DIM option in [Spectrum Analyzer Processing]>"Parameter Measurement">"IMD". The corresponding MultiTones configuration files for DIM30 and DIM100 test signal generation are also provided.
[*] Insert, Modify, Delete, Clear All steps in Device Test Plan will no more automatically close the opened X-Y Plots.
[+] Added [Sticky Move] option in the system menu of the main window of Device Test Plan. When selected, moving the title bar of Device Test Plan will move all its associated X-Y Plots together. This option is ticked by default. Similarly, added [Sticky Move] option in the system menu of the software's main window as well.
[+] Added "Frequency Response" options: White Noise, Pink Noise, Arbitrary under Automatic MultiTones Configuration mode of Signal Generator. It will generate FFT-bin-aligned multitones with the specified frequency response within the specified frequency range.
[+] Added "..." button beside "Mask" in Signal Generator. If clicked, Mask Configuration dialog box will pop up. It is now possible to specify a window function for the "On" duration and "Off/On Amplitude Ratio (dB)". This can be used to geneate various window gated output. By default, Rectangle window is used for "On" duration and zero is output during "Off" duration.
[*] When [Record Length]/[FFT Size] is less than 2 under Coherence Function mode in Spectrum Analyzer, a warning message will be displayed in the center of the Spectrum Analyzer window.
[*] Support Spectrum Analyzer's Inter-Frame Peak Hold or Linear Average for a specified number of frames in Instruction SIO in Device Test Plan when "No Trigger" is ticked.
[+] Added a DDP called NumberOfFrames to show the number of data frame acquired since the start of data acquisition.
[+] Added a DDP called OverallPassFailCheck to show overall Pass / Fail /Nil. If no alarm is configured in all DDP viewers, "Nil" will be displayed (=0). If any alarm is detected, "Fail" will be displayed (<0). If no alarm is detected, "Pass" will be displayed (>0).
[+] Added [Copy As Text] and [Export] options in the context menu of DDP Viewer.
[+] Added "+Reverse" option in Signal Generator to allow backward sweep after the forward sweep when "Loop" is ticked.
[+] Added Total Distortion and Noise (TD+N) option in [Spectrum Analyzer Processing]>"Parameter Measurement">"Peaks". If selected, the detected peaks will be considered as the multitone stimulus and the rest will be considered as the total distortion and noise. The corresponding DDPs are: TDN_A(%), TDN_A(dB), TDN_B(%), TDN_B(dB).
[+] Added Blackman Harris 7, Cosine Sum 220, Cosine Sum 233, Cosine Sum 246, Cosine Sum 261 window functions in Spectrum Analyzer. The corresponding 24-bit 1024-point wave files are also added in \wav\window subdirectory of the software for reference.
[*] Added "N" and "lbf" options in [Setting]>[Calibration]>"Sensor">"Unit".
[*] "-C-" will be displayed at the lower left corner of Spectrum Analyzer to indicate [Spectrum Analyzer Processing]>"Intra-Frame Processing">"Compensation1" or "Compensation2" is selected.
[*] Added 99.1%, 99.2%,...,99.9% options in Window Overlap Percentage in Spectrum Analyzer View Parameter Toolbar.
[*] Added grid and more axis labels in Spectrum 3D Plot for better quantitative view.
[+] Added [Spectrum 3D Plot Processing] tab.
[+] Added 1/1, 1/3, 1/6, 1/12, 1/24, 1/48, 1/96 Octave options for [Spectrum 3D Plot X Scale]
[+] Added [Spectrum 3D Plot Y Scale]>"Shift Display Range by (dB)" and now it is possible to zoom in/out along Y axes.
[+] Added [Spectrum 3D Plot Chart Options]>"Spectrogram">"Smoothing" option. It smooths the graph along both time and frequency axes through interpolation.
[+] Added Inter-Frame and Intra-Frame options in Spectrum 3D Plot View Parameter Toolbar. It is now possible to split one oscilloscope frame of data into multiple FFT segments and generate a Spectrum 3D Plot through the newly added Intra-frame option. Intra-frame mode supports two analysis modes: Short Time Fourier Transform (STFT) and Cumulative Spectral Decay (CSD).
[+] Added [Spectrum Analyzer Processing]>"Intra-Frame Processing">"Circular Correlation" option. If ticked, the Auto Correlation function and Cross Correlation function in Spectrum Analyzer will change from linear correlation to circular correlation. It can be used as one of the impulse response measurement methods.
[*] The two channels of data used in Cross Correlation computation in Spectrum Analyzer are swapped. When Cross Correlation function is used to obtain the impulse response, the stimulus should be in Ch. B and the response should be in Ch. A. This arrangement is now consistent with that of the Transfer Function measurement.
[*] The exported text files of Auto Correlation function, Cross Correlation function and Impulse Response in Spectrum Analyzer can now be imported via [File]>[Import].
[+] Added Derived Data Curves (DDC) button in the Instrument & Miscellaneous Toolbar. Maximum 8 DDC windows can be opened concurrently. The following DDCs are available:
(1) Energy Time Curve (Log-Squared)
(2) Energy Time Curve (Envelop)
(3) Energy Time Curve (dBSPL)
(4) Impulse Response Schroeder Integration Curve
(5) Step Response From Impulse Response Integration
(6) Frequency Time Curve
It is possible to apply a 1/1 octave filter from 63Hz to 8kHz or 1/3 octave filter from 50Hz to 10kHz to the time-domain data non-destructively before deriving the above DDCs.
[+] Added [Oscilloscope Processing]>[Parameter Measurement]>"Reverberation / Speech Intelligibility" option. If ticked, reverberation analysis according to ISO3382 and speech intelligibility analysis according to IEC 60268-16 will be performed. The analyses can be based on either 1/1 or 1/3 octave bands. Parameters that can be measured include Early Decay
Time (EDT), Reverberation Time RT60 (through T20 or T30), Clarity C50 and C80, Definition D50, Center Time Ts, Modulation Transfer Function (MTF), Articulation Loss of Consonants %ALcons and Speech Transmission Index (STI). The results are stored in DDP arrays: AcousticParameter_A_Array and AcousticParameter_B_Array. They can be viewed as a report through DDP Array Viewer:
(1) A-Reverberation / Speech Intelligibility (1/1 Octave)
(2) B-Reverberation / Speech Intelligibility (1/1 Octave)
(3) A-Reverberation / Speech Intelligibility (1/3 Octave)
(4) B-Reverberation / Speech Intelligibility (1/3 Octave)
[+] Added [Oscilloscope Processing]>[Parameter Measurement]>[Discontinuity] option. If ticked, the maximum waveform discontinuity value and its time of occurrence will be stored in DDPs:MaxDiscontinuityValue_A(%), MaxDiscontinuityTime_A(ms), MaxDiscontinuityValue_B(%) and MaxDiscontinuityTime_B(ms).
[*] "iB=oA" loopback mode of Signal Generator allows feeding a signal of more than 1s into Oscilloscope, in order to facilitate impulse response and transfer function measurements using single-channel mode.
[+] Added Panel Setting Files for ANSI/CEA-2010 subwoofer max. SPL test.
[+] Added Panel Setting Files for single-channel impulse response and transfer function measurements.
[+] "Copy As Text" and Export functions in Spectrum 3D Plot can export data in slices of time or slices of frequency. A pop up message will prompt for user selection.
Thanks, MI Pro.
In additon to the new features highlighted in the above Posting #616, some more are highlighted as follows:
5. Reverberation analysis via Intra-frame waterfall plot.

6. Cumulative Spectral Decay (CSD)

7. ANSI / CEA-2010 Subwoofer Peak SPL Test

8. DIM30, DIM100

9. Total Distortion + Noise (TD+N)

10. Energy Time Curve

11. Frequency Time Curve

...
Thank you all for your interest in MI3.9.
In additon to the new features highlighted in the above Posting #616, some more are highlighted as follows:
5. Reverberation analysis via Intra-frame waterfall plot.
6. Cumulative Spectral Decay (CSD)
7. ANSI / CEA-2010 Subwoofer Peak SPL Test
8. DIM30, DIM100
9. Total Distortion + Noise (TD+N)
10. Energy Time Curve
11. Frequency Time Curve
...
Thank you all for your interest in MI3.9.

- Status
- This old topic is closed. If you want to reopen this topic, contact a moderator using the "Report Post" button.
- Home
- Group Buys
- GB for Virtins MI Pro for RTX6001 autoranging/autoscaling & for soundcard end users