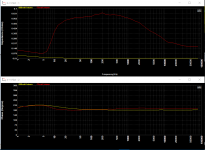
Virtins, I tested a shunt regulator and I observed that with a low internal reg current I took wrong measurements (see the first attachment, the 300mA internal reg current is right but the 70mA internal reg current the graph is completely wrong).
I remember that you had setup the output to 10V differential (100mA current).
I remember the Jan Didden' words that he told me that the generator current not to exceed the 10-15% of total dc load current.
For that reason, I tried to modify the .dtp file and the .psf files to 2V output.
I opened the .dip file -> Editor -> change the steps 10, 14 and 18 from 10V to 2V (I done an insert and then delete the line with 10V).
But, I lost the Impedance and Phase window graph and I can't find how to restore them.
I run the new .dtp, I see that the measurement impedance is right but without graph.
Any help?
Attachments
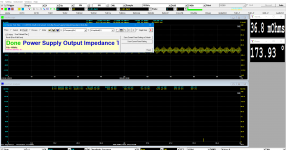
When you edit a device test plan, any existing X-Y Plots will be closed. You will need to reconfigure them. After finishing editing the device test plan,
(1) Select “A-Frequency(Hz)” for X axis, “Impedance (ohms)” for Y axis and then click the “X-Y Plot” button to open a X-Y Plot for Impedance ~ Frequency Graph.
(2) Select “A-Frequency(Hz)” for X axis, “Phase (Degree)” for Y axis and then click the “X-Y Plot” button to open a X-Y Plot for Phase ~ Frequency Graph.
(3) Right click each X-Y plot to configure their X and Y Scales properly. Position and size the above two X-Y Plots properly on the screen and then click the File Save button to save the modified device test plan.
The above X selection box, Y selection box, X-Y plot button and File Save button can be found at top of the Device Test Plan window.
The device test plan can also be modified through a text editor such as Windows Notepad. In this way, you will not need to reconfigure the X-Y Plots for this particular case.
You are the best, I have told you again.
From what I have understand, the AC current from the generator is important to right measurement.
A general rule about this, is to be 10-15% of DC-Load Current.
Nice to change the output gen. value output via Notepad, quickly! This change needs to done only to .dtp file not to .psf files, isn't it?
I think will be good to have the ability to put a Title and subtitle to the X-Y Plot (perhaps to next VI-Pro version).
Attachments
Keep in mind the impedance defined by the active circuitry (instead of a cap) can be quite nonlinear with amplitude. You should look at the supply behavior at currents up to the peak load current. Most supplies are not equipped to sink current (except shunt regulators and designs specifically tailored to that task) so keep in mind the max current you push in. A lot of what you are exploring can be done using a fast load switch (power Mosfet in series with a resistor) to stress the load from off to on and back. Some of the speaker measurement software like Arta could be persuaded to transform that impulse (voltage and current measured) into impedance vs frequency. I don't know if Virtins can do that. Its similar to the load tests for IC power supply chips.
Demian, the non linearity at the graph of post 463, not caused by the PSU but from generator current that was big. The 75-80mV at the V2 point of Virtin's diagram caused overload input.
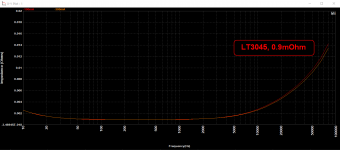
Because I didn't know how to change the .dtp flle, I done a manual measurement with analogue generator and TrueRMS multimeters - but I had keep the generator current btw 10-15% of total PSU load - without any non linearity issues of PSU.
The Zo was good as LTSpice said.
Because I didn't know how to change the .dtp flle, I done a manual measurement with analogue generator and TrueRMS multimeters - but I had keep the generator current btw 10-15% of total PSU load - without any non linearity issues of PSU.
The Zo was good as LTSpice said.
From what I have understand, the AC current from the generator is important to right measurement.
A general rule about this, is to be 10-15% of DC-Load Current.
Nice to change the output gen. value output via Notepad, quickly! This change needs to done only to .dtp file not to .psf files, isn't it?
I think will be good to have the ability to put a Title and subtitle to the X-Y Plot (perhaps to next VI-Pro version).
.dtp is a txt file while .psf is a binary file. Thus a psf file cannot be edited using a TXT editor.
Thank you for the suggestion of allowing users to configure the title of the X-Y Plots. It will be added most likely in the future.
Power supply output impedance generally varies with the DC load. AC perturbation needs to be small compared with the DC current, so that it will not deviate the power supply too much from its normal behavior at that particular DC load. Similarly for power supply control loop test.
@Demian
Impulse can be used as a stimulus in MI for (speaker) impedance measurement Methods 1 & 2 mentioned in Post #393. The spectrum of an impulse is flat, similar to that of a white noise. In fact, Bode Plot and Impedance/Phase Plot can be measured in one-shot using any broad-band stimulus (no need to be very flat). The frequency stepped sine activation method gives the highest SNR, though.
By the way, I think I stated wrongly in Post #393 that the existing impedance measurement method 1 & 2 in MI cannot be used to measure the power supply output impedance
 . It should be possible using Method 1 & 2 through a different connection.
Last edited:
On the selection of perturbation stimuli
Different perturbation stimuli can be used to disturb the power supply system in the frequency range of interest. They result in a different measurement SNR and time. Measurement methods using broad-band stimuli such as frequency swept sine, impulse, white noise, pink noise, etc. are faster than those using frequency stepped sine. But the latter provides the best measurement SNR, especially if the measured magnitude and phase are extracted using FFT from the particular very-narrow-banded test frequency instead of the overall waveform, which improves the SNR drastically under noisy conditions as shown previously.
Power supply output impedance measurement can be very noisy because the output impedance of a power supply is generally very low (in the order of tens of milliohms) and the instantaneous perturbation is not allowed to exceed a certain small percentage of the normal working load. The resulting perturbation AC voltage across the power supply is thus very low (a few uV to a few mV) and noisy. For example, assuming that the power supply output impedance is to be measured at an output current around 100 mA, the max. allowed perturbation AC current is then limited to about 10 mA. If the output impedance of the power supply is 0.01 ohms, then the perturbation AC voltage drop across the power supply is only about 100 uV. Therefore a stimulus resulting in a high measurement SNR is desirable.
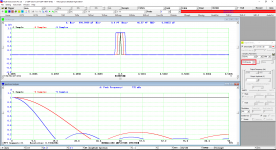
Among the aforementioned broad-band stimuli, impulse stimulus provides the least SNR as it pumps the least perturbation energy into the system under test. Its instant amplitude is also severely restricted here by the small perturbation requirement. Time wise, an impulse with a duration of one sample is the whitest. One can pump in more excitation energy to improve SNR by increasing the time duration of the impulse at the cost of the relative drop of activation energy at high frequencies. This effect is illustrated in the following picture, which shows an impulse of 1 sample, 5 samples, 9 samples and their respective spectra. Basically, the spectrum of a square impulse is a SINC function. The wider the square pulse, the narrower its spectrum. Thus the SNR at high frequencies will be getting worse as the impulse time duration increases.
Different perturbation stimuli can be used to disturb the power supply system in the frequency range of interest. They result in a different measurement SNR and time. Measurement methods using broad-band stimuli such as frequency swept sine, impulse, white noise, pink noise, etc. are faster than those using frequency stepped sine. But the latter provides the best measurement SNR, especially if the measured magnitude and phase are extracted using FFT from the particular very-narrow-banded test frequency instead of the overall waveform, which improves the SNR drastically under noisy conditions as shown previously.
Power supply output impedance measurement can be very noisy because the output impedance of a power supply is generally very low (in the order of tens of milliohms) and the instantaneous perturbation is not allowed to exceed a certain small percentage of the normal working load. The resulting perturbation AC voltage across the power supply is thus very low (a few uV to a few mV) and noisy. For example, assuming that the power supply output impedance is to be measured at an output current around 100 mA, the max. allowed perturbation AC current is then limited to about 10 mA. If the output impedance of the power supply is 0.01 ohms, then the perturbation AC voltage drop across the power supply is only about 100 uV. Therefore a stimulus resulting in a high measurement SNR is desirable.
Among the aforementioned broad-band stimuli, impulse stimulus provides the least SNR as it pumps the least perturbation energy into the system under test. Its instant amplitude is also severely restricted here by the small perturbation requirement. Time wise, an impulse with a duration of one sample is the whitest. One can pump in more excitation energy to improve SNR by increasing the time duration of the impulse at the cost of the relative drop of activation energy at high frequencies. This effect is illustrated in the following picture, which shows an impulse of 1 sample, 5 samples, 9 samples and their respective spectra. Basically, the spectrum of a square impulse is a SINC function. The wider the square pulse, the narrower its spectrum. Thus the SNR at high frequencies will be getting worse as the impulse time duration increases.
Attachments
Transformer for Isolation and Impedance Conversion
There is no need to keep the 1:1 ratio. Besides the isolation benefit, a transformer can provide impedance conversion in order to have the capability to pump more energy from the RTX6001 signal generator into the power supply under test. This will be useful if a perturbation current of more than 100 mA is required. Currently, without the transformer, most of the perturbation energy is consumed by the output impedance of RTX6001's signal generator itself and the max. perturbation AC current is limited to about 100mA.
There is no need to keep the 1:1 ratio. Besides the isolation benefit, a transformer can provide impedance conversion in order to have the capability to pump more energy from the RTX6001 signal generator into the power supply under test. This will be useful if a perturbation current of more than 100 mA is required. Currently, without the transformer, most of the perturbation energy is consumed by the output impedance of RTX6001's signal generator itself and the max. perturbation AC current is limited to about 100mA.
Last edited:
As a newbie/amateur I'd just like to say a big thank you to V/R and Virtins for this software (and of course Jens for the reason to develop it). Not only is it plainly useful as it is to me, but the continued conversations here add ever more value. Honestly I have learned at least as much as the software cost if I'd invested it in 'training'.
This is what forums should be for, so thanks guys!
This is what forums should be for, so thanks guys!
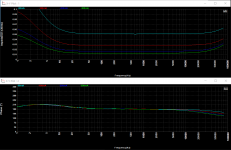
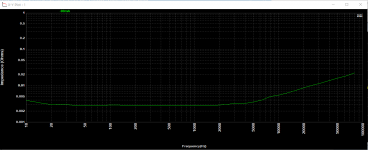
The frequency response of transformer isn't a limit factor about this measurement. Most Lundahl line-in transfo has until 70-85KHz response with ±0.5dB
Yes Jazid, you have right!
Thanks again to all for the help.
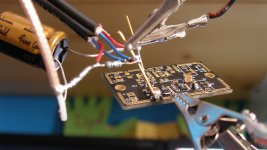
A small sample from the wonderful toy (MI-Pro & RTX) that we have
Yes Jazid, you have right!
Thanks again to all for the help.
A small sample from the wonderful toy (MI-Pro & RTX) that we have
Attachments
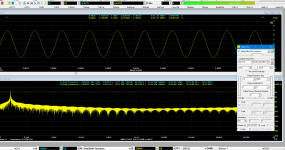
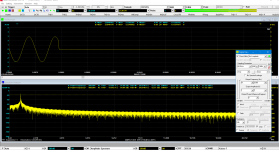
I have a problem to have a THD dac measurement.
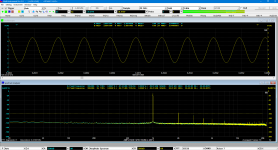
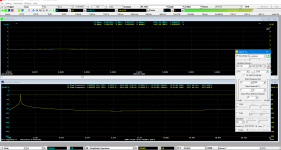
If the source was the foobar and the output goes to RTX input, it is OK (capture 4).
This DAC uses an usb receiver (Amanero Combo).
If I choose on the MI DAC section the Asio: Combo Amanero and the MI ADC the RTX as input, I can't take right measurement, the RMS output isn't stable and the oscilloscope captures burst signal or nothing or normal with a random series (captures 1-3). Probably this is normal because double use of the ASIO driver, one for the Amanero and the other for the RTX
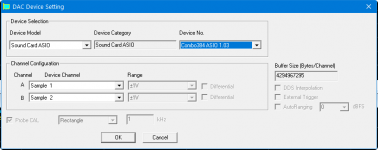
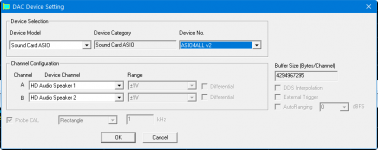
Additional, I tried with Asio4all a driver that have the capable to customize the input and output. At the MI DAC driver, I found the Asio4all driver but only with HD Audio Speaker output.
There is no any other button to customize the asio4all driver.
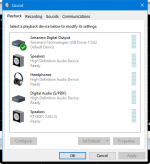
Of course if I choose as is the asio4all driver, when I press the Play at the Signal Generator, I listen the output from the PC Speaker not via Amanero, the windows audio setup is OK (Win 10 Pro).
Any help?
If the source was the foobar and the output goes to RTX input, it is OK (capture 4).
This DAC uses an usb receiver (Amanero Combo).
If I choose on the MI DAC section the Asio: Combo Amanero and the MI ADC the RTX as input, I can't take right measurement, the RMS output isn't stable and the oscilloscope captures burst signal or nothing or normal with a random series (captures 1-3). Probably this is normal because double use of the ASIO driver, one for the Amanero and the other for the RTX
Additional, I tried with Asio4all a driver that have the capable to customize the input and output. At the MI DAC driver, I found the Asio4all driver but only with HD Audio Speaker output.
There is no any other button to customize the asio4all driver.
Of course if I choose as is the asio4all driver, when I press the Play at the Signal Generator, I listen the output from the PC Speaker not via Amanero, the windows audio setup is OK (Win 10 Pro).
Any help?
Attachments
Last edited:
- Status
- This old topic is closed. If you want to reopen this topic, contact a moderator using the "Report Post" button.
- Home
- Group Buys
- GB for Virtins MI Pro for RTX6001 autoranging/autoscaling & for soundcard end users