There is one change I'd really like to see. The ability to run channel 2 alone. So you would have channel 1 channel 1 & 2 then channel 2 in the drop down menu. That allows us to see channel 2 separately which is what I need to do.
This will probably be provided in the near future. Currently, you can sample both Ch. A & Ch. B, then click the respective graph, and select "Off" in the "A Range" selection ComboBox at the bottom of the screen to hide the curve of Ch. A. It can also be hidden by setting the color of Ch. A to the background color.
Guys, something goes wrong with my measurements.
I have made two kind of Zo measurements.
A. without RTX - two Fluke RMS multimeters on V1 & V2 measure Vac values . A function generator (Hameg HM-605) feeds the ac signal without any transfo btw. A Rigol dc load, a 1uF capacitor and 1R resistor.
The following diagram seems the connection on this test.
View attachment 705493
Here the array with results and a diagram of Ζο on three dc-loads (0.1/0.5/1.0A).
At the Impedance Zo column the formula Z=-R*(V1/V2) used for the Zo, but this gives negative values! I used the positive values of them and draw the diagram.
View attachment 705495
B. Next, I followed the Virtin's directions with the RTX-6001 (I removed the 1:1 transfo, I haven't complete yet). The connection was as following:
View attachment 705494
I run the script on DUT and I had completely different results than A
View attachment 705492
What I have done wrong! Please, any help will be welcome!
1. First of all, without the transformer, the ground loop issue may occur.
2. The DC blocking capacitor must be large enough so that the AC current flowing through the DC load is of second order (negligible) as compared with that flowing through R. Please note that the capacitor is 1mF not 1uF in the original diagram.
3. Not sure if your Fluke RMS multimeters is able to measure true RMS at 1MHz (as shown in your spreadsheet) or not.
4. The formula is a vector division. The negative sign will be shown in the phase difference.
5. In the PSF files I provided, both Ch. A and Ch. B use a measurement range of 1.414V, however, for real measurement, you may need to adjust it to achieve the best SNR. For example, in the real measurement, V2 is usually much higher than V1, therefore, different measurement range should be used for the two channels.
To diagnose, I would suggest to use the PSF file (modify it if necessary) and measure the impedance at a single frequency one by one first.
Many thanks for the Help, Virtins.
I have done some testing with this, but I would like to clarify some points with the connection.
1) The signal output of RTX will be the SE?
2) As you wrote we used the two ADC inputs Ch.A & Ch.B. for the V1 & V2 respectively. For V1->hot(2) of xlr Ch.A and for V2 hot(2) of xlr Ch.B or cold(3)?
3) What about gnd(1) of xlr? We let them without connection?
(1) It should not matter much. The balanced out might be slightly better because it allows better signal/noise ratio.
(2) and (3) Remember that the ADC reading reflects the voltage difference between the "hot" and "cold" pins. I'd therefore use the "hot" of channels A and B to sample the voltages, and connect the "cold" to GND in order to provide the "zero" voltage reference. I don't see any need to connect the XLR shield to your test setup, except if you need to connect the RTX chassis to it. That would establish a connection of your PSU to safety earth, if you have a three-prong mains wire on your RTX. This would create a ground loop if your PSU is already connected to safety earth.
Guys, something goes wrong with my measurements.
A. without RTX - two Fluke RMS multimeters on V1 & V2 measure Vac values . A function generator (Hameg HM-605) feeds the ac signal without any transfo btw. A Rigol dc load, a 1uF capacitor and 1R resistor.
What I have done wrong! Please, any help will be welcome!
If you are measuring impedance the phase angle is critical to separate resisitive and reactive components. Two voltmeters that do not have a phase reference won't be able to do the measurement except at DC.
The principle is to measure the ratio of the voltages across the series resistor and across the load. The current will be the same in both so the impedance should be the same as the ratio of the voltages, except that the reactive component shifts the phase. A two port system can measure the phase relationship between the two voltages and calculate the reactive element. The transformer isolation of the source is a good idea but the transformer will limit the frequency range.
but the transformer will limit the frequency range.
...and so does the sampling frequency of the RTX. Even with an ideal transformer, the RTX will not give you anything higher than 96 kHz (Nyquist frequency with 192 kHz sampling).
Hi VIRTINS,
Thank you. I'll be looking forward to that change. In the meantime I'll try your suggestions. I just want to avoid extra steps and do things explicitly without tricks (work arounds). I should have mentioned this a lot earlier, but it only occurred to me while using MI.
-Chris
Thank you. I'll be looking forward to that change. In the meantime I'll try your suggestions. I just want to avoid extra steps and do things explicitly without tricks (work arounds). I should have mentioned this a lot earlier, but it only occurred to me while using MI.
-Chris
1. First of all, without the transformer, the ground loop issue may occur.
- Yes, you have right. But, I haven't complete the transfo yet.
2. The DC blocking capacitor must be large enough so that the AC current flowing through the DC load is of second order (negligible) as compared with that flowing through R. Please note that the capacitor is 1mF not 1uF in the original diagram.
- It was missing by my, sorry for that! I will correct this immediately!
3. Not sure if your Fluke RMS multimeters is able to measure true RMS at 1MHz (as shown in your spreadsheet) or not.
- Another fault by me, sorry for second time! From what I see from the datasheet of Fluke45, the multimeter can measure frequency above 1MHz with level sensitivity (sine wave, RMS) 30mV for the range 5Hz-100Khz, 100mV for the 100K-300K and 1Vrms for the 1MHz but at the AC Voltage (AC-Coupled) section the accuracy (linear and dB) of Frequency measurement are until 100KHz and there is no any reference above from 100KHz.
(1) It should not matter much. The balanced out might be slightly better because it allows better signal/noise ratio.
(2) and (3) Remember that the ADC reading reflects the voltage difference between the "hot" and "cold" pins. I'd therefore use the "hot" of channels A and B to sample the voltages, and connect the "cold" to GND in order to provide the "zero" voltage reference. I don't see any need to connect the XLR shield to your test setup, except if you need to connect the RTX chassis to it. That would establish a connection of your PSU to safety earth, if you have a three-prong mains wire on your RTX. This would create a ground loop if your PSU is already connected to safety earth.
1) Using differential output would nearly double the output voltage, as compared with SE output, which is preferred when the power supply's output impedance to be measure is very low.
2) V1 and V2 are ground referenced voltage. V2 hot(2) should be used. Using cold(3) of xlr Ch.B is also OK, as long as the 180 phase difference is accounted for in the phase vs frequency plot. It will not affect the |Impedance| reading.
3) No need to connect gnd(1) of xlr.
- OK, I done some measurements with the mbrenwwa connection and Virtins connection, but I didn't see any significant difference between the two ways of gnd connection.
The connection that I used, demonstrated at the follow:

This is the graph that I have taken of 1084 psu @ 0.1A

This is the graph that I have taken of 4 LT3045 regs parallel (identical graph at 0.1A/0.5A/1.0A)

I surprised, when I saw that the two captures from the two different PSU are almost identical at the Zo and phase.
Is that a devil coincidence or something goes wrong again?
5. In the PSF files I provided, both Ch. A and Ch. B use a measurement range of 1.414V, however, for real measurement, you may need to adjust it to achieve the best SNR. For example, in the real measurement, V2 is usually much higher than V1, therefore, different measurement range should be used for the two channels.
To diagnose, I would suggest to use the PSF file (modify it if necessary) and measure the impedance at a single frequency one by one first.
- Thanks for the info, I am going to see and understand all of these better...
- The connection that I used, demonstrated at the follow:
View attachment 705863
RTX ADC Cold Ch. A & B should be connected to the GND of power supply, but that was not shown in your diagram?
Yeap, I think we catch the problem!
Now, it is very close with that I have with analogue signal generator and multi-meter procedure.
I tried it with SE signal output of RTX.

Thanks Virtins, again.
The last one that I would like to clarify it is the phase up and down to some frequencies. I have repeat the test and this isn't stable to the specific frequencies varies btw the range of 100Hz-1KHz with one or two or three reversing phase.
Now, it is very close with that I have with analogue signal generator and multi-meter procedure.
I tried it with SE signal output of RTX.
Thanks Virtins, again.
The last one that I would like to clarify it is the phase up and down to some frequencies. I have repeat the test and this isn't stable to the specific frequencies varies btw the range of 100Hz-1KHz with one or two or three reversing phase.
Last edited:
Phase Wrapping
Thanks for posting the result. It looks correct. Based on the result, some improvement on the setting can be done.
1. Phase Wrapping Issue
Those abrupt phase changes in your phase vs frequency plot are of 360 degrees. Thus it is a phase wrapping issue rather than a phase reversal one. If you unwrap the phase, the changes will look gradual and continuous. Since the measured phase difference is around 180 degrees within the frequency range of interest, therefore it would be good to wrap the phase difference in the range of 0~360 degrees instead of the current -180~180 degrees to avoid the phase wrapping issue. I have thus updated the definition of the phase shift in the three PSF files as follows:
UDDP2(Phase):
IFIN([f1Phase_B(D)]-[f1Phase_A(D)],0,360,[f1Phase_B(D)]-[f1Phase_A(D)],0)+
IFGT([f1Phase_B(D)]-[f1Phase_A(D)],360,[f1Phase_B(D)]-[f1Phase_A(D)]-360,0)+
IFLT([f1Phase_B(D)]-[f1Phase_A(D)],0,[f1Phase_B(D)]-[f1Phase_A(D)]+360,0)
Basically, what the above definition does is that,
If the phase difference between Ch. B and Ch. A is within 0~360 degrees, then no change.
If it is greater than 360 degrees, then it should minuses 360.
If it is less than 0 degrees, then it should add 360.
In MI, the phase angle DDPs for ch. A and ch. B: [f1Phase_A(D)] and [f1Phase_B(D)], are always within -180~180 degrees. Therefore their difference will be in the range of -360~360 degrees, thus there is a need to wrap that difference within a range of 360 degrees. For this particular application, it would be good to wrap it in the range of 0~360 degrees instead of -180~180 degrees.
2. Optimal Input Range Setting
In the device test plan, a sine wave with an amplitude of 10V (differential) is used. Given the output impedance of RTX6001 (100 ohms differential), the AC peak voltage across R (1 ohms) would be lower than 100mV, the AC peak voltage across the Power Supply’s output impedance would be even lower. Therefore setting the input range of RTX6001 to +/-141.4mV for both input channels will achieve the best measurement SNR. I have thus updated the input range setting in the three PSF files.
The updated PSF and DTP files are attached.
Attachments
Virtins, thnx for the support.
It is my pleasure to help for the routines improvement.
Something goes wrong at this time.
I remember all my measurements are with Ch.B SE RTX output (not differential output).
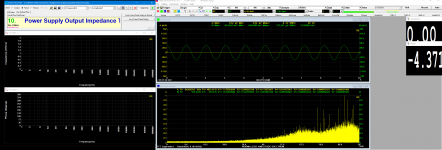
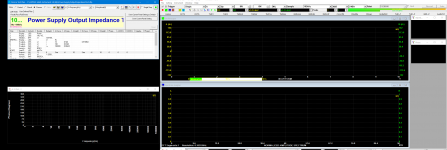
Here the results with the older version of PowerSupplyOutputImpedanceTest.
Capture from 1-100000Hz (I have attached and the export Zo & Phase .txt files (demo1_Zo & demo1_phase).

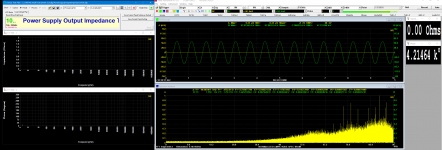
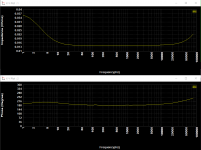
Here the results with the new version of PowerSupplyOutputImpedanceTest.
Capture from 1-100000Hz (I have attached and the demo2_Zo & demo2_phase).

Some captures during test at the end of attached files.
It is my pleasure to help for the routines improvement.
Something goes wrong at this time.
I remember all my measurements are with Ch.B SE RTX output (not differential output).
Here the results with the older version of PowerSupplyOutputImpedanceTest.
Capture from 1-100000Hz (I have attached and the export Zo & Phase .txt files (demo1_Zo & demo1_phase).
Here the results with the new version of PowerSupplyOutputImpedanceTest.
Capture from 1-100000Hz (I have attached and the demo2_Zo & demo2_phase).
Some captures during test at the end of attached files.
Attachments
Last edited:
Yes, the Input Ch.A seems to have no signal with the new Test_Zo!
I know that that the number of decimal places in Impedance window, affect only the display and not the plot but it is a feedback that everything is going well.
I measured a shunt psu and all the time it saw 0.00 but at the end when I zoomed the Y axis of Zo plot I saw that the Zo was at 0.0015 Ohm!
I know that that the number of decimal places in Impedance window, affect only the display and not the plot but it is a feedback that everything is going well.
I measured a shunt psu and all the time it saw 0.00 but at the end when I zoomed the Y axis of Zo plot I saw that the Zo was at 0.0015 Ohm!
Yes, I can to test another for sure, but the same time I had take the measurements with the older file and there is no any issue on Input Ch.A...I haven't movement any cables any connection.
What I observed about this.
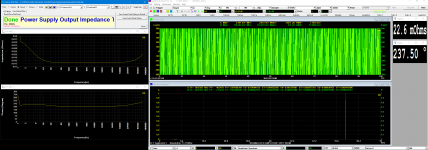
When turn on the RTX and run the MI, I listen the relay OK. Start the DUT and open the test file...Just, press the play, I listen again the relay to take the new position (at the minimum attenuation) and see the Ch.A works well (see the first attachment).
After some seconds and probably when this measure the 1.23+Hz the Ch.A Level goes to minimum and stay there.
If I closed everything and running again the MI, this cycle is repeating...
Look at the two attachments, please.
What I observed about this.
When turn on the RTX and run the MI, I listen the relay OK. Start the DUT and open the test file...Just, press the play, I listen again the relay to take the new position (at the minimum attenuation) and see the Ch.A works well (see the first attachment).
After some seconds and probably when this measure the 1.23+Hz the Ch.A Level goes to minimum and stay there.
If I closed everything and running again the MI, this cycle is repeating...
Look at the two attachments, please.
Attachments
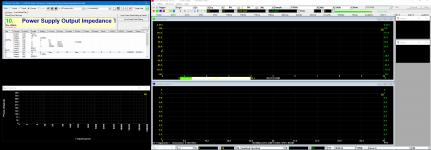
The two screenshots show the signal-capturing status but not signal-captured status?
Since the old files seem to be working. You can actually update the old files by yourself.
(1) Load an old PSF via [Setting]>[Load Panel Setting]
(2) Change the input ranges from +/-1.414V to +/-141.4mV for both channels
(3) Change the phase UDDP definition according to Post #431
(4) Save it to the same PSF via [Setting]>[Save Current Panel Setting]
(5) Load the DTP file in the Device Test Plan
(6) Change the Y range from -180~180 degrees to 0~360 degrees in the phase ~ frequency graph and save it.
The two screenshots show the signal-capturing status but not signal-captured status?
Since the old files seem to be working. You can actually update the old files by yourself.
(1) Load an old PSF via [Setting]>[Load Panel Setting]
(2) Change the input ranges from +/-1.414V to +/-141.4mV for both channels
(3) Change the phase UDDP definition according to Post #431
(4) Save it to the same PSF via [Setting]>[Save Current Panel Setting]
(5) Load the DTP file in the Device Test Plan
(6) Change the Y range from -180~180 degrees to 0~360 degrees in the phase ~ frequency graph and save it.
- Thanks for the tip. Now, I can to modify it alone without to spend your time!
Actually, I loaded the new psf files and change the Ch.A input range.
From what I saw, only with ±14.14V-±141.4V can be measure Impedance on Channel Input A. At these ranges the voltage input status is (1.23-1.26mV), at the others (±141.4mV - ± 4.472V) the voltage input status is (65nV-1.93μV) and it can't to make measurement.
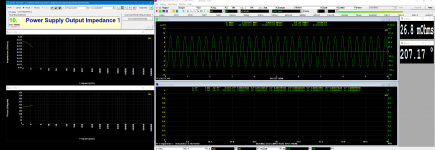
At the range ±14.14V input you have the best impedance measurement (1st capture).
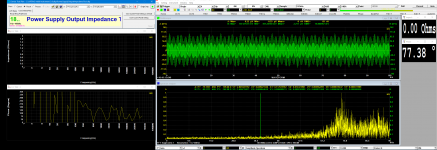
If I let the Input Channel B at the ±141.4mV the results are the same like before but now you can see better the wave at the oscilloscope (2nd capture).
It seems that there is something issue with the low input range, I don't know the cause. It is a sw bug or something with RTX?
At the last, I know that we can exact the data from the DUT graph (.txt file) and import to excel for example.
Is there something else that we save the measurements and call them like overlays on plot? For example, we would like to measure and demonstrate a Zo of PSU @0.1/0.5/1.0A current load at the same plot.
Attachments
- Status
- This old topic is closed. If you want to reopen this topic, contact a moderator using the "Report Post" button.
- Home
- Group Buys
- GB for Virtins MI Pro for RTX6001 autoranging/autoscaling & for soundcard end users