The autoranging rule is now user configurable. 0 dBFS is the default value but the user can modify it.
....
Is that usable to our version?
From what I have seen the input Vrms doesn't change (auto setup) with the DAC Autoranging 0 or -3 or -6dB...almost 706mV with 1V output.
Continuous / On-Demand AutoRanging, AutoScaling, AutoSetting
RTX6001 has three output ranges: +/-14.14V, +/-1.414V, and +/-0.1414V. For DAC AutoRanging, 0 dBFS (peak value) is the default switching threshold. If you output an amplitude of 1.41V, the output range of RTX6001 will be set to 1.414V. If you output an amplitude of 1.42V, then the output range will step up to 14.14V. Now, if you change the switching threshold to -3dBFS (peak value), then when you output an amplitude above 1V, it will switch the output range to 14.14V. It will switch the output range to 1.414V only when the output amplitude is below 1V and above 0.1V. This may be useful for some cases such as a THD test where the best THD is often obtained at a few dB below 0 dBFS. I tested the above again, it worked.
The following are the summary of the AutoRanging, AutoScaling, AutoSetting function in MI.
1. ADC AutoRanging
(1) On-Demand AutoRanging is provided via the “Auto” button at the upper right corner of the screen.
(2) Continuous AutoRanging can be enabled via [Setting]>[ADC Device]>”AutoRanging".
The AutoRanging criterion for the above (1) and (2) can be configured via [Setting]>[ADC Device]>”AutoRanging”> “dBFS”
2. DAC AutoRanging
(1) Continuous AutoRanging can be enabled via [Setting]>[DAC Device]>”Auto Ranging”.
The AutoRanging criterion for the above (1) can be configured via [Setting]>[DAC Device]>”AutoRanging”> “dBFS”
3. AutoScaling (Graphical Scaling)
(1) On-Demand AutoScaling on a graph window (i.e. oscilloscope, spectrum analyzer, spectrum 3D Plot) is provided via right click the graph window and select “AutoScaling”.
(2) Continuous AutoScaling can be enabled via [Setting]>[ADC Device]>”AutoScaling”.
4. AutoSetting
The behavior of the “Auto” button at the upper right corner of the main window is now configurable. For RTX6001, it is configured as an on-demand ADC AutoRanging button by default. You can reset it to an ordinary on-demand ADC AutoSetting (often seen in an ordinary oscilloscope) button if you untick the “Auto Button for AutoRanging Only” option via [Setting]>[ADC Device]. Then, in addition to the AutoRanging function, it will change the Sampling Rate and / or Sampling Duration such that 5~10 signal cycles are captured in the oscilloscope.
Last edited:
Virtins, many thanks for this post!
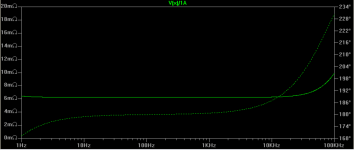
Is that the possibility to measure the impedance output of a power supply with the MI-Pro, something like the following capture?
The x axis the frequency (to 95KHz for RTX), the y axis the impedance output and the secondary y axis the phase. I imagine that we need an electronic dc load at the PSU output to CC mode.
Is that possible and if it yes, could you give us a diagram of connection?
Attachments
Hi lemon,
That is a pretty specific use, but I have seen connection diagrams for such a measurement. They also do tests where they break the feedback connection so they can inject a signal into the power supply for measurements.
I don't know if VIRTINS would know about this very specific test, but if you search for such a thing you would both find out. That looks like a phase and Bode plot to me translated to resistance. I would expect the resistance in that display to start off lower and rise with frequency. It's very strange for it to be flat.
-Chris
That is an impedance plot which should be pretty straightforward. However you need to get the gain and phase difference between the channels. Its all there but needs to be processed. Its probably somewhere in the manual. . .
Making an interface is a different and challenging task. There is some discussion over in the Bode 100 thread. The low source Z of the RTX would be beneficial for this.
Making an interface is a different and challenging task. There is some discussion over in the Bode 100 thread. The low source Z of the RTX would be beneficial for this.
Virtins, many thanks for this post!
Is that the possibility to measure the impedance output of a power supply with the MI-Pro, something like the following capture?
The x axis the frequency (to 95KHz for RTX), the y axis the impedance output and the secondary y axis the phase. I imagine that we need an electronic dc load at the PSU output to CC mode.
Is that possible and if it yes, could you give us a diagram of connection?
It's a matter of measuring the voltage change for a given current. You'd need to connect a circuit that loads the PSU according to a test signal coming from the RTX DAC, and then measure the corresponding voltage change using the RTX ADCs. Maybe a cirucit similar to an "impedance" jig as used for loudspeaker impedance measurements might work to sense the output current using the seconds RTX ADC. I have no idea if MI Pro implements the required data processing (FFT of signals, determine current from sense resistor, divide voltage and current data to get impedance).
If the MI-pro have this capability, we will be grateful to VIRTINS if they can to presentation to us.
If this including to some Virtins Paper, a link will be useful, also.
This is the reason that ask this measurement, here.
Please to everyone. My english isn't good and I prefer some kind of diagram to understand better if there is solution with some kind of equipment.
For the some solution without MI-Pro including, please post to Practical instructions for PSU output impedance measuring vs frequency (power supplies thread), I have set the same question (without MI-Pro including)
I have another situation for the Virtins (sorry for that, guys).
At the "EOSC10Kv3 - LT AN67 10kHz oscillator : new updated version !", somebody upload a link of APx555 (YouTube) that AP claims that produced the best analyzer at the market.
For this reason, except the DAC signal generator it is include a pure signal generator that push the THD+N at the -121dB with some digital processing and notch filter (time from 02:00 and then).

I followed with a test of RTX6001 & MI-Pro with the same parameters of signal and amplitude and saw how our combination produce the same almost measurement with -121+dB THD+N measurement.

Jens, saw this measurement and wrote:
In reality, as I saw that AP applied a tricky at the digital processing stage, I applied a Linear Average at the Inter-Frame Processing (Oscillator) of MI-Pro.
Without this filtering THD+N is almost -104dB.
But, with this filter goes to -121-122dB .
.
Yes, I was used a tricky method, but AP is completely clear?
At the "EOSC10Kv3 - LT AN67 10kHz oscillator : new updated version !", somebody upload a link of APx555 (YouTube) that AP claims that produced the best analyzer at the market.
For this reason, except the DAC signal generator it is include a pure signal generator that push the THD+N at the -121dB with some digital processing and notch filter (time from 02:00 and then).
I followed with a test of RTX6001 & MI-Pro with the same parameters of signal and amplitude and saw how our combination produce the same almost measurement with -121+dB THD+N measurement.
Jens, saw this measurement and wrote:
While I do think the the performance is good
So I think there is something wrong with the settings in the MI Pro. Perhaps the noise is not included correctly or only for a very narrow bandwith?
....
In reality, as I saw that AP applied a tricky at the digital processing stage, I applied a Linear Average at the Inter-Frame Processing (Oscillator) of MI-Pro.
Without this filtering THD+N is almost -104dB.
But, with this filter goes to -121-122dB
.Yes, I was used a tricky method, but AP is completely clear?
Hi Lemon,
Thank you for the information.
In case you meant the THD+N is "too good" after synchronous average in time domain in MI, please refer to my Post #379, where I stated that "Synchronous averaging in time domain helps to improve the THD+N, but not THD".
In case you meant the THD+N is "too bad" without synchronous average in time domain in MI, I would like to highlight that currently MI accommodates 250PPM jittering in test frequency only which is stringent. Fundamental beyond that range will be considered as noises.
For power supply output impedance see
Watt's Up?: How can I measure output impedance of a DC power supply?
For an output impedance of a preamp for example Jensen transformers page once had this pdf available.
Watt's Up?: How can I measure output impedance of a DC power supply?
For an output impedance of a preamp for example Jensen transformers page once had this pdf available.
Power Supply Output Impedance Measurement
There are a few ways in MI to measure impedance:
1. Single-Channel Method (Stimulus: frequency linearly or logarithmically swept sine, multitones capable of simultaneously stimulating all FFT/octave frequency bands in the frequency range of interest, etc.).
Basically it converts a RMS amplitude spectrum plot to an Impedance vs Frequency plot. Please refer to Section 3.2.1.10 of the software manual for details.
2. Dual-Channel Method (Stimulus: frequency linear or logarithmically swept sine, white noise, pink noise, multitones capable of simultaneously stimulating all FFT frequency bands in the frequency range of interest, etc.).
Basically it converts a BODE Plot to an Impedance & Phase vs Frequency plot. Please refer to Section 3.2.6.10 of the software manual for details.
3. LCR meter (Impedance only, Stimulus: Frequency Stepped Sine), please refer to Chapter 9 of the software manual for details.
4. Device Test Plan (Can be configured to measure both impedance and phase, Stimulus: Frequency Stepped Sine), please refer to Chapter 8 of the software manual for details.
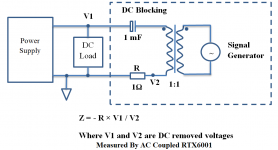
The method to measure the impedance of a passive component such as L, C, R or a network of them (e.g. speaker) are quite straightforward. However, measuring the output impedance of a power supply requires some specific methods. The following diagram shows one of the methods.
In this method, a sine wave current disturbance is injected from the signal generator through a transformer. The output impedance can be obtained by Z=-R*V1/V2. Unfortunately, this formula is a little different from the two formulae currently supported by the Impedance Analyzer Function of MI (The above item 2, supporting this new formula may be included in the future). However, it can be done through the Device Test Plan. You can define two User Defined Data Point (UDDP, refer to Section 10.2.2 of the software manual for details) using the following math formulae (Assuming V1 and V2 are connected to Ch. A and Ch. B respectively):
UDDP1: R x RMS_A(EU)/RMS_B(EU)
UDDP2: f1Phase_B(D)-f1Phase_A(D)
You can then generate stepped sine wave stimuli step by step and plot the Impedance vs Frequency and Phase vs Frequency in two X-Y Plots.
Is that the possibility to measure the impedance output of a power supply with the MI-Pro, something like the following capture?
The x axis the frequency (to 95KHz for RTX), the y axis the impedance output and the secondary y axis the phase. I imagine that we need an electronic dc load at the PSU output to CC mode.
Is that possible and if it yes, could you give us a diagram of connection?
There are a few ways in MI to measure impedance:
1. Single-Channel Method (Stimulus: frequency linearly or logarithmically swept sine, multitones capable of simultaneously stimulating all FFT/octave frequency bands in the frequency range of interest, etc.).
Basically it converts a RMS amplitude spectrum plot to an Impedance vs Frequency plot. Please refer to Section 3.2.1.10 of the software manual for details.
2. Dual-Channel Method (Stimulus: frequency linear or logarithmically swept sine, white noise, pink noise, multitones capable of simultaneously stimulating all FFT frequency bands in the frequency range of interest, etc.).
Basically it converts a BODE Plot to an Impedance & Phase vs Frequency plot. Please refer to Section 3.2.6.10 of the software manual for details.
3. LCR meter (Impedance only, Stimulus: Frequency Stepped Sine), please refer to Chapter 9 of the software manual for details.
4. Device Test Plan (Can be configured to measure both impedance and phase, Stimulus: Frequency Stepped Sine), please refer to Chapter 8 of the software manual for details.
The method to measure the impedance of a passive component such as L, C, R or a network of them (e.g. speaker) are quite straightforward. However, measuring the output impedance of a power supply requires some specific methods. The following diagram shows one of the methods.
In this method, a sine wave current disturbance is injected from the signal generator through a transformer. The output impedance can be obtained by Z=-R*V1/V2. Unfortunately, this formula is a little different from the two formulae currently supported by the Impedance Analyzer Function of MI (The above item 2, supporting this new formula may be included in the future). However, it can be done through the Device Test Plan. You can define two User Defined Data Point (UDDP, refer to Section 10.2.2 of the software manual for details) using the following math formulae (Assuming V1 and V2 are connected to Ch. A and Ch. B respectively):
UDDP1: R x RMS_A(EU)/RMS_B(EU)
UDDP2: f1Phase_B(D)-f1Phase_A(D)
You can then generate stepped sine wave stimuli step by step and plot the Impedance vs Frequency and Phase vs Frequency in two X-Y Plots.
Attachments
Oh, what information are they? This is happy!
@ergo = thanks for the links very much, the first one I think is the same like the Virtins diagram.
No, I didn't meant that the THD+N without average at the oscilloscope domain was bad!
For this reason, I upload this measurement to saw that with our combination of sw & hw we can to measure a -121dB THD+N measurement.
The words of Jens "that probably this is an error of MI-Pro setup" because the RTX can't to measure a -121dB THD+N, confuse me and put here this measurement to talk about it.
I would like to thank you, you are very kindly and answer to all our questions, immediately!
Your information about impedance measurement are marvellous, I need some time to understand these and I come back....
@ergo = thanks for the links very much, the first one I think is the same like the Virtins diagram.
Hi Lemon,
Thank you for the information.
In case you meant the THD+N is "too good" after synchronous average in time domain in MI, please refer to my Post #379, where I stated that "Synchronous averaging in time domain helps to improve the THD+N, but not THD".
In case you meant the THD+N is "too bad" without synchronous average in time domain in MI, I would like to highlight that currently MI accommodates 250PPM jittering in test frequency only which is stringent. Fundamental beyond that range will be considered as noises.
No, I didn't meant that the THD+N without average at the oscilloscope domain was bad!
For this reason, I upload this measurement to saw that with our combination of sw & hw we can to measure a -121dB THD+N measurement.
The words of Jens "that probably this is an error of MI-Pro setup" because the RTX can't to measure a -121dB THD+N, confuse me and put here this measurement to talk about it.
I would like to thank you, you are very kindly and answer to all our questions, immediately!
Your information about impedance measurement are marvellous, I need some time to understand these and I come back....
There are a few ways in MI to measure impedance:
...
4. Device Test Plan (Can be configured to measure both impedance and phase, Stimulus: Frequency Stepped Sine), please refer to Chapter 8 of the software manual for details.
...
The following diagram shows one of the methods.
In this method, a sine wave current disturbance is injected from the signal generator through a transformer. The output impedance can be obtained by Z=-R*V1/V2. Unfortunately, this formula is a little different from the two formulae currently supported by the Impedance Analyzer Function of MI (The above item 2, supporting this new formula may be included in the future). However, it can be done through the Device Test Plan. You can define two User Defined Data Point (UDDP, refer to Section 10.2.2 of the software manual for details) using the following math formulae (Assuming V1 and V2 are connected to Ch. A and Ch. B respectively):
UDDP1: R x RMS_A(EU)/RMS_B(EU)
UDDP2: f1Phase_B(D)-f1Phase_A(D)
You can then generate stepped sine wave stimuli step by step and plot the Impedance vs Frequency and Phase vs Frequency in two X-Y Plots.
OK, I will try the method 4 via Device Test Plan, but I will need more time, the DTP procedure is unknown to me for now.
I have a Rigol dc load, then it is easy this implementation in my situation.
But, it is not clear to me the role of the dc blocking capacitor and line transformer in the circuit?
OK, I will try the method 4 via Device Test Plan, but I will need more time, the DTP procedure is unknown to me for now.
I have a Rigol dc load, then it is easy this implementation in my situation.
But, it is not clear to me the role of the dc blocking capacitor and line transformer in the circuit?
The transformer is used to inject an AC signal to the PSU output. The capacitor keeps the DC away from the transformer, while it passes the AC signal from the transformer to the PSU.
The 1 Ohm resistor is used to convert the AC current flowing through the transformer winding to a voltage signal that can be recorded with the RTX ADC.
@mbrennwa, thanks.
I understand the role of capacitor over transfo, but why need a 1:1 transfo at the output of signal generator (RTX output)?
For better noise cancellation, for gnd "braking", for what?
I think if the transfo removed, the capacitor must removed and stay only the R 1Ohm.
I understand the role of capacitor over transfo, but why need a 1:1 transfo at the output of signal generator (RTX output)?
For better noise cancellation, for gnd "braking", for what?
I think if the transfo removed, the capacitor must removed and stay only the R 1Ohm.
@mbrennwa, thanks.
I understand the role of capacitor over transfo, but why need a 1:1 transfo at the output of signal generator (RTX output)?
For better noise cancellation, for gnd "braking", for what?
I think if the transfo removed, the capacitor must removed and stay only the R 1Ohm.
The AC voltage "inserted" to the PSU corresponds to the RTX DAC output voltage multiplied by the winding ratio of the transformer. It's therefore easier to use a 1:1 winding ratio, but you can use other ratios as long as you measure the true AC voltage at the PSU output using one of the RTX ADC channels.
Removing the transformer and capacitor may cause ground loops and would expose the RTX DAC output to the PSU DC voltage (sounds like asking for trouble). Also, with only the 1 Ohm resistor left, the PSU DC output would be loaded by the resistor, and either the PSU or the resistor might not be up to that.
- Status
- This old topic is closed. If you want to reopen this topic, contact a moderator using the "Report Post" button.
- Home
- Group Buys
- GB for Virtins MI Pro for RTX6001 autoranging/autoscaling & for soundcard end users