"Scott - what is you like about the older plots (using a software package that is now obsolete) and the newer ones (using my own software)? Is it the one dB line? The colors? I am not sure that I understand. Since I write the graphics that I use now I can make them like the older ones if I wanted to, but:
1) one dB steps for the lines got very dense in many situations and I found 3 dB step to be more reasonable.
2) the colors were chosen after a complaint I got about the colors! I read an article about the use of color in graphs and a strong point was made about how the colors chosen should correlate with the values presented in a visual sense - high sound intensity should correlate with high visual intensity - bright colors mean high SPL, dark is low SPL."
Earl,
There are several reasons I like the older plot better, and I've written them out in Word (and will post it if you want), but will try to get to the "finer points" here cutting-out an "excerpt".
1. Dense is good, but only if it has certain qualities I'll mention below (in the "excerpt", particularly #2 in that excerpt).
2. The complaint was a good complaint, and the article seems to be pointing you in the correct direction - the problem is with the finer points of that application (..which would require me posting more of what I've written rather than the abbreviated excerpt below).
EXCERPT:
Color Highlighting:
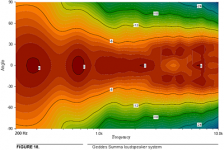
The impetus for this thread is pretty much the result of wanting to know *why* I thought the Summa displayed more resolution. While the range of colors is what I’m first drawn to, and the sense of resolution partly focuses on Red (as the “warning”), there are two components that really help display resolution:
1. The shades of color are FAR greater on the old Summa plot than on the Abbey, and
2. The shades of color are being highlighted to better differentiate between shades from most of those shade “steps”. (..this is easiest to spot in the “steps” of Orange approaching Yellow. As you go from a darker shade “step” of Orange to a lighter shade “step” of Orange the transition for the next “step” is actually lighter in color and becomes darker as you approach the next lighter “step”.)
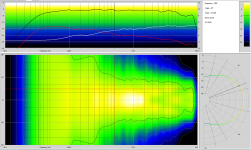
When you consider both qualities regarding the Abbey plot – it doesn't even compare. The Yellow looks like Yellow and the Green looks like Green. If you look at it *really* closely you can see a “bleeding” effect, particularly from Green to Blue, but it’s minimal. In no case does it have the appearance of something more discreet (or “steps”). Just one shade of Green alone seems to have a 12db range! And what, about 4db of indistinct Yellow?
Still, the Summa plot has problems with that -18db to -23db range – where it all looks Green and there isn't any real highlighting going on
Note: The rest of what I've written focuses more on color (and goes further into its use for your application).
If you want it posted as well - let me know here (..I'll check this thread over this week).
1) one dB steps for the lines got very dense in many situations and I found 3 dB step to be more reasonable.
2) the colors were chosen after a complaint I got about the colors! I read an article about the use of color in graphs and a strong point was made about how the colors chosen should correlate with the values presented in a visual sense - high sound intensity should correlate with high visual intensity - bright colors mean high SPL, dark is low SPL."
Earl,
There are several reasons I like the older plot better, and I've written them out in Word (and will post it if you want), but will try to get to the "finer points" here cutting-out an "excerpt".
1. Dense is good, but only if it has certain qualities I'll mention below (in the "excerpt", particularly #2 in that excerpt).
2. The complaint was a good complaint, and the article seems to be pointing you in the correct direction - the problem is with the finer points of that application (..which would require me posting more of what I've written rather than the abbreviated excerpt below).
EXCERPT:
Color Highlighting:
The impetus for this thread is pretty much the result of wanting to know *why* I thought the Summa displayed more resolution. While the range of colors is what I’m first drawn to, and the sense of resolution partly focuses on Red (as the “warning”), there are two components that really help display resolution:
1. The shades of color are FAR greater on the old Summa plot than on the Abbey, and
2. The shades of color are being highlighted to better differentiate between shades from most of those shade “steps”. (..this is easiest to spot in the “steps” of Orange approaching Yellow. As you go from a darker shade “step” of Orange to a lighter shade “step” of Orange the transition for the next “step” is actually lighter in color and becomes darker as you approach the next lighter “step”.)
When you consider both qualities regarding the Abbey plot – it doesn't even compare. The Yellow looks like Yellow and the Green looks like Green. If you look at it *really* closely you can see a “bleeding” effect, particularly from Green to Blue, but it’s minimal. In no case does it have the appearance of something more discreet (or “steps”). Just one shade of Green alone seems to have a 12db range! And what, about 4db of indistinct Yellow?
Still, the Summa plot has problems with that -18db to -23db range – where it all looks Green and there isn't any real highlighting going on
Note: The rest of what I've written focuses more on color (and goes further into its use for your application).
If you want it posted as well - let me know here (..I'll check this thread over this week).
Attachments
..I would like to see the rest of the comments..
I looked over the week, and didn't see a response so I deleted it.

It was mostly due to the color transition.
Red & Yellow: warning colors.
Orange and Green: dominate colors (that don't "warn").
Blue and Violet: subdued colors.
Use of Orange is the best color for most of the dominate/average plot you want to focus on. Orange is stronger than Green and it allows for a more complete spectrum of colors (dark Orange to Purple). Use MANY shades of Orange, more than the Summa plot.
Because it's still a piece of marketing, don't use a pure Red for the range of intensity beyond the average - instead have it as a "blood Orange". It's enough to show high resolution, but there isn't any need to "shout it". Looking at the old Summa plot you have 700 Hz (0 degrees) emphasized in dark Red, move 4 "steps" in pressure down from there as your max spl "Red color" (..or something closer to a "blood Orange". (..there is a better use of a dark Red as mentioned below.)
Another thing the old Summa plot does well is use a single "step" as pure Yellow. It's the best highlight color (a weak warning).
One thing you really need to do however is determine exactly what "step" you want to highlight. IMO I'd select a specific pressure loss from your reference axis that you feel best serves as an indicator to your off-axis/toe-in scheme. Maybe -3db from your reference (ie. Abbey's 22 degree)?
Speaking of reference axis, the Abbey plot's added dark Red line seems correct to provide maximum attention to that axis. However, I'd keep it within the confines of the "step" rather than simply an axis. (..as for dark Red color, I'd go back to the Summa's darkest red for that "step".) Essentially this will provide an operating range of shades of Orange with this one "stand-out" step that is in dark Red. This should make it visually "pop" (as the step that best expresses the axis you want people to look at most), and at the same time "minimize" areas of intensity above the average in "blood Orange". It should also contrast well (perhaps 3 "steps" down) with the Yellow line.
Provide spl #'s for ONLY the reference line (dark Red), and your preferred pressure loss line (pure Yellow). This should keep the viewer informed of what you want them to focus on in the design, while still allowing them to count the "steps" up (or down) for excellent resolution.
Important: Minimize the use of Green.
While Green is "weaker" than Orange, it's still an "operating" color. (..in the Summa plot their is sort of a visual "struggle" going on with Orange and Green - there shouldn't be.)
Continue with the sort of shading the Summa plot has for about 4 steps beyond pure Yellow into Green.
In fact, I wouldn't use a pure Green at all for any step, I'd just transition from Yellow-Green to Green Blue.
I'd probably use on single pure "blue" to express the outer-limit of pressure loss for the design (..maybe where the Yellow line is on the Summa, or perhaps the Green-Blue transition on the Abbey).
From there range into the Violets - Blue to Violet shadings that are still light in color. At a "step" where you want to show even more loss - start into deeper shades of Violet.
In essence you want the plot to be mostly composed of Orange and Violet.
http://www.karendiamonddesigns.com/wp-content/uploads/2010/05/Untitled-1.png
Sort of:
A range of Oranges (darker to lighter), Dark Red with spl # (referencing the step most covered by the reference listening axis), small range of Oranges to Yellows, pure Yellow with spl # (referencing the step most covered by the desired pressure loss axis), small range of Yellows to Green, small range of Greens to Blue, single pure Blue (referencing outer spl operation), small range of Blue to Violet, wider range of Violets (lighter to darker). Possibly a black line overlaying the reference axis (as you have currently as dark Red in the Abbey plot).
..or something like that.
Last edited:
I looked over the week, and didn't see a response so I deleted it.
I didn't see your first post until yesterday. I didn't expect it here.
What you are suggesting might be very difficult from a programming standpoint. That is because there is not a mathematically definable transition from level to color, as there is now, and each level would have to be programmed in a specific color. This adds a huge amount of programming overhead when compared to just defining two colors and letting windows fill in the gradient. Its not too hard to do with say 6 levels, or maybe 10, but every dB over a 36 dB range would be a nightmare of coding.
I'll look into it.
No, prob.s..
(I think the post mostly expressed what I'd written before.)Ah, didn't consider it from a programming point of view.
-even 30 db is a pretty good range if it gets the coloring and gradient feature right. Each "step's" gradient however might be brutal.
- Status
- This old topic is closed. If you want to reopen this topic, contact a moderator using the "Report Post" button.
- Home
- More Vendors...
- GedLee
- Directivity Plot Differences..