If you have the IR buffer from SoundEasy for this transducer, would you please e-mail it to me? That way we will not take this thread off topic.
I would like to do my own post processing of the IR and see if what I come up with matches your waterfall. Also, if you can send me the file, please tell me if you smoothed the IR data.
I would like to do my own post processing of the IR and see if what I come up with matches your waterfall. Also, if you can send me the file, please tell me if you smoothed the IR data.
MarkMcK said:Yes.
Good to know about you not using this option. IR smoothing does not leave a trail if you do and that is a problem.
Thanks in advance
I hope you've been receiving my mail. I haven't heard from you since you asked questions about the data I sent you.
Speaking of myself in the third person, Mark is interested in how people are faking the data they post to market their work and products.
I am not pointing fingers at any particular posters or companies, but there are certainly a lot of suspect posts made to this forum. Some provide no evidence but the posters own impressions. Others post data that cannot be duplicated. Some post transformations of measurements that cannot be replicated even using that posters own raw data files. This last instance is particularly strange.
Besides finding out what data manipulations people are willing to use, I am also developing new knowledge about detecting and correcting material vibration modes. This is just part and parcel of my business and a logical consequence of holding a Ph.D. There is this strange idea that going through the process of achieving the Ph.D. prepares you to increase our knowledge base.
Lastly, as indicated in my posts to this thread I have been working on metal diaphragms. Since my last post here, that work has continued. I can control the major vibration modes evident in the W4-657SB. I have not looked at the SC version yet, but I am confident that I can control the problems of this newer version as well.
Because of an email inquiry, I do plan to make available the test results of the work on the SB and any future work on the SC. I will not be releasing detailed information on how to change the cone. Since some have found my release of detailed instructions "inspiring" for their own commercial activities, I am reluctant to ever do so again. Besides, just knowing that something can be done is all the inspiration a competent designer should need.
Mark
Golly, it's been a long time since this thread was touched.
I think if I ever had a question about specific data, I would ask directly. I know that lots of people do many tests, and what goes to advertisements usually is only one specific condition. Sometimes I ask questions and don't get answers. In my experience 80% of the time they don't have the answers. I try not to directly accuse people of faking data, but rather push to the point when they won't be able to explain themselves. Most stop responding because, for example, if I ask for phase data, then they know that I can cross check the response. If I ask about how smoothing is done, and ask for unsmoothed data, they know that their previous data will not stand cross reference.
Right now I teach my children that PHD is one way of having a higher starting salary, what they really learn has no relation with whether they have such high education or not. Many people, including myself can go to doctors when we feel bad, but get told we are perfectly healthy by measureable standards. Sound famliar? Well, unfortunately, ever since my university studies, whenever I ask about association of particular equations or methods with physical phenomena, I either get blank looks, or upset looks.
We have asked universities to do certain very specific studies, when I look at the reports, most do not relate with reality at all, and these BSes, and PHDs are just fighting to save face. Very few come up with realistic results.
Regarding treatement of cones, I think even if I post pictures of my work, lots need to be replicated accurately to obtain the same results. Like some work I've done in the ENABL thread using the JX92S driver. That actually inspired much more thought than just application of the pattern itself. I hope to get hands on tools to do some structural modes analysis soon. The real critical issue is having performance repeatability in producing these. High frequencies in small metal cones such as 3" ones are really hard to deal with; high frequency in larger cones such as 4"~5" cones are much easier; 6.5" metal drivers are a hell to deal with.
Part of the human condition is an unending capacity to rationalize one's own beliefs. Again, when such statements are made, if they are ever to be substantive, then evidence must be provided that goes beyond mere personal subjective testimony.
There are bad people who have Ph.D.s. There are bad people who acquire MD degrees. There are bad people who have no degrees. There are people who routinely do bad things to other people and do not define themselves as a bad person (back to the endless capacity for self rationalization).
Having instrumentation is important. By the number of faked reports, one can see that instrumentation alone is not enough. In addition there must be an understanding of the limitations both of the instrumentation and of the devices under test.
From comments made to forums like this, there is a possibility that few understand what they are seeing. They cannot tell what makes a good test and a bad test. Few seem to care as long as they can rationalize the test to support what they already believe. I suppose this explains why a personal testimonial seems to count for so much. And that is a testimonial from someone with no qualifications.
Anyway, my function (self defined) here is to bring a little more scientific skepticism to the discussion, provide testing examples that are revealing instead of concealing, and maybe even talk a little about what specific tests reveal and what they can't reveal.
Lastly, George makes claims about the difficulty of working with different sizes of metal cones. I disagree. Repeatability is not a problem when appropriate design practices are used in setting up construction or modification. While different sized metal cones respond differently, each can be made to behave by the appropriate techniques. For myself, the determination of size to target is based upon the design idea of a full range transducer. A three-inch transducer of any cone material cannot produce sufficient low frequencies. Six-inch and larger cones have the problem of excessive mass for motor strength, and generally because larger cones use a larger VC and have a larger X-max, they have too much inductance to go full range on the top end. That leaves us somewhere between three and six-inches for the best compromise to produce a full range transducer.
I think it more appropriate to focus on specifics rather than generalizations. Currently I have not seen any work on metal cones. The W4-657 are now in the SH version. The JX92S that I had just used for test out of curiosity seemed quite easy to work with. I welcome any specific questions or comments in that specific thread. I just wish we get into more meaningful discussion on the subject. I did wonder whether spider resonances are effecting the W4-657SB or not, but I have no experience with this driver. Looking at the waterfall, the ridge near 7KHz is probably going to be a little difficult to deal with. With 6.5" drivers, that ridge is usually somehwere between 4KHz to 6KHz. I have played with one cone that had a more soft ridge.
I also think it no good practice to talk about fake data out of the specific thread where the data is located. Whenever we find questionalbe data, we should raise it right where the data is being presented, and be precise about where we see the problem is.
As far as difficulty with drivers, I can only speak from the 3 or more 3", one JX92S, and four or more 6.5" drivers that I have worked with. I'm sure there may be others that have worked with more. I do wonder how many metal cones Mark has worked with. Probably just tell us a few that are easy ones?
The best 6.5" that show most potential going full range are the JX125 series, unfortunately they are currently out of production. I think the most difficult issue in getting a good driver that uses proprietary technology into production is manufacturing process, which is one reason that the JX125 could not be produced now. If you have a new production line and get the process fixed and the tolorances controlled, then repeatability won't be an issue. But that takes lots of investment and one need to figure out what the return is.
Just a general warning . . . if easy is what you are looking for then you need to look in another thread. There are plenty of threads from a limited number of authors claiming significant improvements with ease. They slather the cones with all sorts of doping materials. One even suggested toothpaste.
All I can say is "BEWARE!"
As I have already stated, I am not going to be giving modification details. I do want to speak about measurement/analysis/graphing and measurement of the W4-657.
I am starting with measurements. There will be five images to illustrate just a couple aspects of measurement/analysis/graphing.
For me this is obvious and general knowledge, so forgive me if it is obvious and general for you too. First, all signal acquisition and analysis software suites have quirks. Not good or bad, just the way things are.
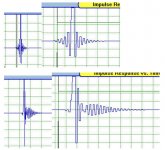
The first attachment is a Praxis display of an ideal dirac impulse response (IR). The data for the IR consists of just one positive integer preceded and followed by long strings of zero values. In the old days, we would graph this with bars. Since we were working with discrete data values we graphed them as such. Today, most of the software tries to imitate what would be seen on the screen of an analog oscilloscope displaying an analog signal.
For this example, the three data points graphed have time signatures of 3.7926667, 3.8135, and 3.8343333 msec. The only actual time signature with an associated data value is 3.8135. Regardless, as is proper, the graphing shows symmetrical rise and fall.
The second graph in the first attachment shows the frequency response and phase response of the ideal dirac. You can't actual see the frequency response because it is a perfect match of the phase response and is thus hidden.
Now, how do you get the phase response. Phase is an arbitrary concept. You might have seen a few SpeakerWorkshop posting with this weird looking increase frequency sawtooth pattern overlying the frequency response. This is caused by the arbitrary start of the phase transformation being set to the start of the data file and not the relevant data.
To get a more useful phase transformation you have to account for this difference in the beginning of the data set and the time position of the relevant data. For Praxis you input a delay value. This moves the start reference for the phase transformation to whatever data file time position you want. For the phase transformation presented her, that delay time was set to 3.8125 msec. This places the start for the phase transformation to the center of a data place.
SpeakerWorkshop uses a slightly different approach. SpeakerWorkshop sets the start place of the phase transformation through the data start and end of the data truncation option. Instead of placing the start point in the middle of a data time value, it references it to the beginning of a data time value.
Anyway, the next four posts from me will introduce some minor imperfections in the phase transformation set point and some minor imperfections to the IR to show how they impact the frequency and phase response.
Mark
All I can say is "BEWARE!"
As I have already stated, I am not going to be giving modification details. I do want to speak about measurement/analysis/graphing and measurement of the W4-657.
I am starting with measurements. There will be five images to illustrate just a couple aspects of measurement/analysis/graphing.
For me this is obvious and general knowledge, so forgive me if it is obvious and general for you too. First, all signal acquisition and analysis software suites have quirks. Not good or bad, just the way things are.
The first attachment is a Praxis display of an ideal dirac impulse response (IR). The data for the IR consists of just one positive integer preceded and followed by long strings of zero values. In the old days, we would graph this with bars. Since we were working with discrete data values we graphed them as such. Today, most of the software tries to imitate what would be seen on the screen of an analog oscilloscope displaying an analog signal.
For this example, the three data points graphed have time signatures of 3.7926667, 3.8135, and 3.8343333 msec. The only actual time signature with an associated data value is 3.8135. Regardless, as is proper, the graphing shows symmetrical rise and fall.
The second graph in the first attachment shows the frequency response and phase response of the ideal dirac. You can't actual see the frequency response because it is a perfect match of the phase response and is thus hidden.
Now, how do you get the phase response. Phase is an arbitrary concept. You might have seen a few SpeakerWorkshop posting with this weird looking increase frequency sawtooth pattern overlying the frequency response. This is caused by the arbitrary start of the phase transformation being set to the start of the data file and not the relevant data.
To get a more useful phase transformation you have to account for this difference in the beginning of the data set and the time position of the relevant data. For Praxis you input a delay value. This moves the start reference for the phase transformation to whatever data file time position you want. For the phase transformation presented her, that delay time was set to 3.8125 msec. This places the start for the phase transformation to the center of a data place.
SpeakerWorkshop uses a slightly different approach. SpeakerWorkshop sets the start place of the phase transformation through the data start and end of the data truncation option. Instead of placing the start point in the middle of a data time value, it references it to the beginning of a data time value.
Anyway, the next four posts from me will introduce some minor imperfections in the phase transformation set point and some minor imperfections to the IR to show how they impact the frequency and phase response.
Mark
Attachments

Look forward to seeing some interesting things, specifically if it's the TB W4-657SB.
I think there are many ways to work with cones, depending on the material of cones and the purpose of treatement. I'm probably the one that started with toothpaste on metal cones just because it is easy to find the critical points, look at the effects, easy to remove, and the sort to alternative treatment when production of some sort is desired. I actually have toothpaste still on some drivers laying around. Whether tweaking something is easy or not really depends of the final goal and the driver selected, one thing that we can be sure of is that one way normally does not fit all.
For whomever is interested in understanding Speaker Workshop, the source code is now open source. It's quite interesting to know that SW has made an attempt to remove time of flight.
Recent studies helped me realize how flat impedance makes a difference in sound, I difference between smooth to flat and wavily flat made quite audible difference. Equally interesting is that shorting rings create certain sonic signatures in the mid and high frequencies even though graphically it shows better high frequency response due to lowered inductance. Is this easy to understand? Not really. We just need to be aware what the limitations of each implementation are. Yes, the impulse response is a much better way of understanding some of the problems, I think this is an indication that different data makes different problems more understandable, and hopefully easier to solve.
However, how critical is the quality of the generated impulse?
below are impulses generated from two different cards. If we do a loop back test, both will give perfectly flat phase response overlapping the frequency response. Does this make a difference during measurement? Something to think about.
Attachments
My second attachment shows the frequency and phase response when the Praxis delay is set one sample before and one sample after the data. Remember there is only one sample with data value. For this first run I am working with an ideal dirac.
If the delay is set to the sample before the ideal dirac, then the energy is lagging this arbitrarily determined point. And if we set the delay to the sample after, then the data is leading this second arbitrarily set point. Of course, this leading and lagging is frequency dependent and the transformation produces a graph showing the amount of lead or lag increasing with frequency.
Now, the preceding post presents data that belongs in a different conversation. First, those are not graphs of diracs. Instead they are transformations of an mls signal. That transformation and the anti aliasing filter produces very high frequency artifacts. As long as everything has been designed properly in the software, when you further transform the transformed IR to a frequency and phase response the artifacts are higher in frequency than the highest frequency of the analysis. Thus even the odd looking IR responses shown can produce flat frequency responses. If you extend the frequency response graph out to the sample rate (assuming the software you are using will allow for this) you will see the very steep roll-off of the anti aliasing filter. That is what causes the ringing after the IR. Since these are IR transformations, this ringing is also mirrored before the before the IR.
Just because a claim or statement can be said or written does not mean that it has any significance or even meaning. Knowledge builds on knowledge. The more you know about something the better questions you can formulate. The more you know the less likely you are to be confused by meaningless complications. The more you know the less likely you are to confuse symptom and cause.
I suppose a funny example of this is Forrest Gump's mother in the movie "Forrest Gump." One of her two favorite sayings was, "Stupid is as stupid does." One reason that it is funny is that it is empty of meaning. Thus the person saying it is shown to be just as lacking.
So, let us try to the best of our abilities to avoid as much stupidity as we can. Impossible to achieve perfection, but it is good to minimize whenever we can.
Mark
Attachments
A few things that we need to know about the Dirac ideal impulse are:
Infinitely short
Infinite power
Unit energy
Due to this limitation, this cannot happen in reality. We can however use the not-so-ideal Dirac as shown if we are aware of a few things.
1. Output smoothing filters effects of the signal generator and other limited bandwidth equipment before the signal reaches the DUT.
2. The anti-aliasing filter effects.
3. Input and output sample rate effects.
To minimize the effects of these non-ideal conditions, we cannot use the mathematically generated Dirac as the reference, but must use whatever reaches the DUT as the reference. Assuming that in the process of reading back the signal that reaches the DUT and the output from the DUT there is not difference between the anti-aliasing filters, and no latency between the read data, we can then assume that the difference between the signals is caused by the DUT, and thus derive what kind response to the DUT would have occurred if driven by the mathimatically generated Dirac. Note that the assumptions may not be realistic depending on desired accuracy of the measured data.
As shown in the previous post, this is one of the difficulties most face when trying to measure minimum phase, especially when there is a significant time lag involved when reading the DUT response. The higher the sample rate we use, the more ideal Dirac we can get, and the less phase change due to one sample difference when creating a frequency/phase response.
My posts are barely on thread subject and then only because I have measured the 657SB and will be posting more measurements of the 657SB. Soongsc keeps wanting to take this way off topic. I have noticed that this is a pattern he often follows. I guess he just needs to say things and have people respond to him. I will pass on the opportunity from here on.
This attachment is where measurements are a little quirky. The importance of this and my making these preliminary posts is to share some of the problems of measurement. I hope that others looking at posted data will be cognizant of the problems and be more critical. The data fakers always leave behind clues. It is possible to tell who is faking and by how much they are faking their "data." There is no need for me to serve as the data police and catch who is doing dirty deeds. With a little sophistication and knowledge, you can do it to.
The dirac pulse in this example has been low pass filtered. It does, however, still have identical rise and fall times. The data has been redistributed to represent this bandwidth limitation while keeping the energy level the same. The ideal pulse was one significant data point with a value of 1. This second sample has three significant data points with values of .2, .6, and .2. The three significant data points still sum to the number 1.
Despite the symmetrical data, the software graphs the resulting IR as having asymmetrical slopes. Also, by using the same delay from attachment one, while the high frequency response is now limited, we still can show perfect phase. It does this because of the symmetrical data. When measuring transducers, you will never find one with perfectly symmetrical rise and fall times.
Attachments
With attachment four, the impulse response is made asymmetrical. First significant data point has a value of .2 and the second significant data point has a value of .8. Again, the sum is one.
This type of data envelope is commonly seen in transducers. This impulse response is the pattern for when you have a bandwidth limited rising response. The magnitude of the error with actual transducers is usually much worse than shown here, but these two simple imperfect impulse responses of attachments three and four show the sensitivity to error.
We use impulse response transformations to increase our understanding of what we see in the impulse response. Mainly we use a frequency response transformation. Phase response is used less often and is more arbitrary in its presentation and interpretation. I find phase response of little value when evaluating a minimum phase system such as a full range transducer. Still, it is very useful for providing clues for when the data is problematic (whether because of a sad lack of knowledge on the part of the tester or intentional deception).
Attachments
Attachment five shows the one before and one after sample delay offsets for leading and lagging phase. As stated in the reply of attachment two, this is a phenomena of the extremes. Here I have shown high frequency examples. The same applies to the low frequencies as well. No transducer is capable of infinite frequency response and will always show high and low frequency roll-off.
When examining an impulse response file with a phase transformation, look for the unexpected at the extremes. This will always show when excessive equalization has been used.
Also look to the bandpass. As the leading and lagging graphs show, phase will still be zero away from the stop band. When a transducer is claimed to have flat response and yet you cannot get the midband (bandpass) phase close to zero regardless of how you adjust your delay, this is a clue that something unnatural has been done to the data.
This assumes that you have access to the impulse response file. I doubt that I will have many people willing to send their impulse response files anymore. Since my interest was not in if the files were altered, but rather how, I am not concerned with ending my access to questionable data.
Still, most who alter their data are not sophisticated in doing so. Most are much better at changing a frequency response or phase response than they are at changing and impulse response. If you want to question a particular claim, just ask the author to publish the impulse response graph.
The impulse response graph is always more revealing of accuracy. It is also why few people publish it.
As I make available measurements of my last work on the W4-657SB I will try to clarify some of the points I have been trying to make here with these five attachment posts.
The 657SB is an interesting transducer as much because of its problems as because of its potential. It is a nice test case to examine what may be a myth about metal's superiority as a diaphragm material. Maybe it is superior, but I would like to understand why the typical claims for metal are not in evidence.
Attachments
MarkMcK said:
...I doubt that I will have many people willing to send their impulse response files anymore. Since my interest was not in if the files were altered, but rather how, I am not concerned with ending my access to questionable data.
...
I think anyone would not mind sending such data as long as there can be some meaning full discussion concerning the data. At least I know I would if so. Not all tools are perfect. If discussion can reveal shortcommings of various tools, it only helps us all that are using them.
Up to know, the data showing phase shifts due to window starting location are typical for shifts of one sample, meaning that unless the impulse itself is altered, one can make shifts limited to the sample rate of the sound card, and thus the amount of phase shift. I do not see the limit of the previous data, but if those data showing the phase leads and lags are one sample increments when adjusting the window start location, then probably a sample rate of 48KHz is used.
Isn't faking data illegal?
MarkMcK said:I doubt that I will have many people willing to send their impulse response files anymore. Since my interest was not in if the files were altered, but rather how, I am not concerned with ending my access to questionable data..
Since this is in this thread, I have to ask: are you insinuating I or anyone else in this thread faked the data, or that they were taken incorrectly? The generalities don't serve this discussion, please be specific.
Cheers,
Dave
- Status
- This old topic is closed. If you want to reopen this topic, contact a moderator using the "Report Post" button.
- Home
- Loudspeakers
- Full Range
- TB W4-657SB Measures