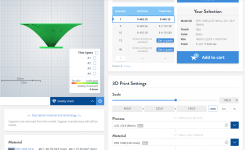
To get a quote on my waveguide, I thickened and added CD mounting ring. The 480mm waveguide came in at almost $1000. I quickly scaled the thing back to 400x225 resimulated and requoted. The new quote was $445. But their error/quality checks indicate I need to improve my CAD process for prepping for 3D printing. I have no idea about the suitability of the material they are quoting; options are limited due to waveguide size unless its printed in sections.

If anything, the smaller waveguide provides better performance.

The horizontal narrowing at XO has been reduced greatly by adding 4 more DMA45s with a passive 2nd order low pass from the other DMA45s that I used to adjust the beam width. Chances are I could reduce the number of these drivers by spreading perhaps just 8 of them out, finding the ideal spacing.
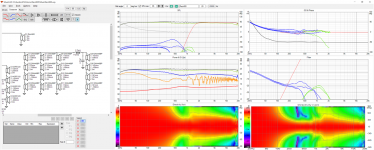
XO frequencies were raised and some overlap introduced. Details are visible below:

Crossover to the waveguide is now at 1300 Hz. I would like to raise it still higher but vertical sidelobes from the arrays appear if I do. This tells me I probably can't shrink the waveguide further, at least not without changing the approach. I'm fairly happy with this size. The baffle will be 412 mm wide and the weight won't be much over 100 lbs.
If anything, the smaller waveguide provides better performance.
The horizontal narrowing at XO has been reduced greatly by adding 4 more DMA45s with a passive 2nd order low pass from the other DMA45s that I used to adjust the beam width. Chances are I could reduce the number of these drivers by spreading perhaps just 8 of them out, finding the ideal spacing.
XO frequencies were raised and some overlap introduced. Details are visible below:
Crossover to the waveguide is now at 1300 Hz. I would like to raise it still higher but vertical sidelobes from the arrays appear if I do. This tells me I probably can't shrink the waveguide further, at least not without changing the approach. I'm fairly happy with this size. The baffle will be 412 mm wide and the weight won't be much over 100 lbs.
Attachments
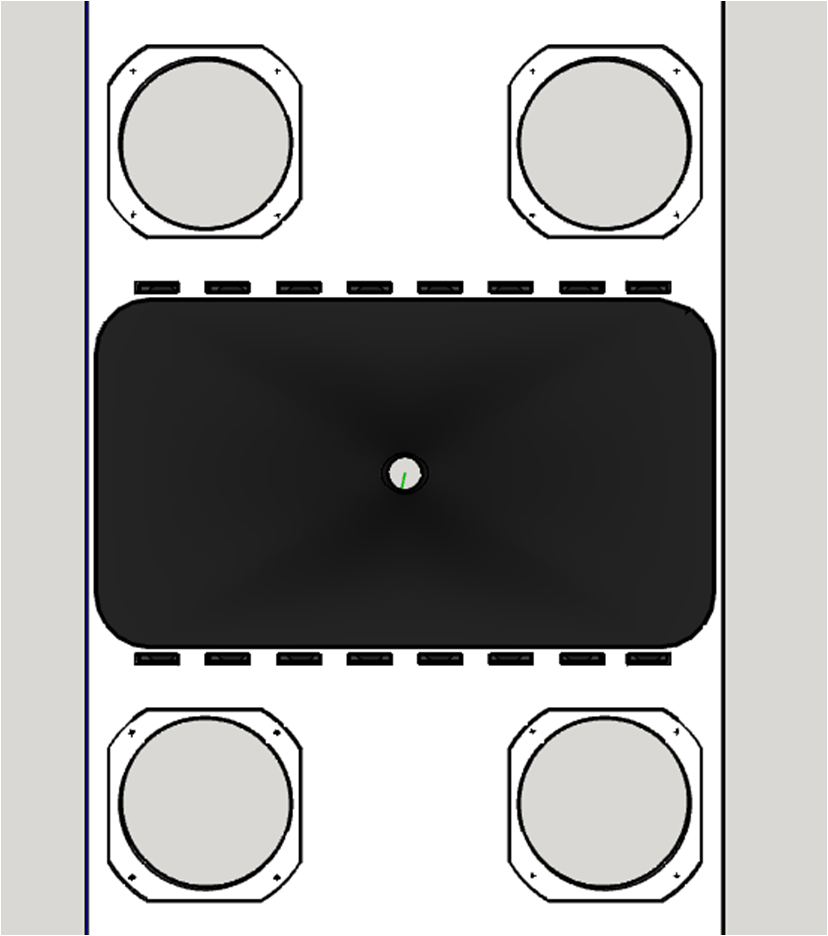
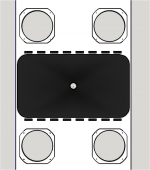
I've been doing some cabinet drawings to provide a dose of reality. Here is a close up of the bare baffle showing the rim slots. On a black baffle, they would be invisible.
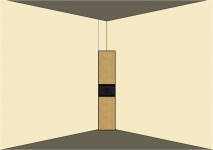
Here is a view of the completed system design tucked away in a corner with the woofers behind grill cloth.
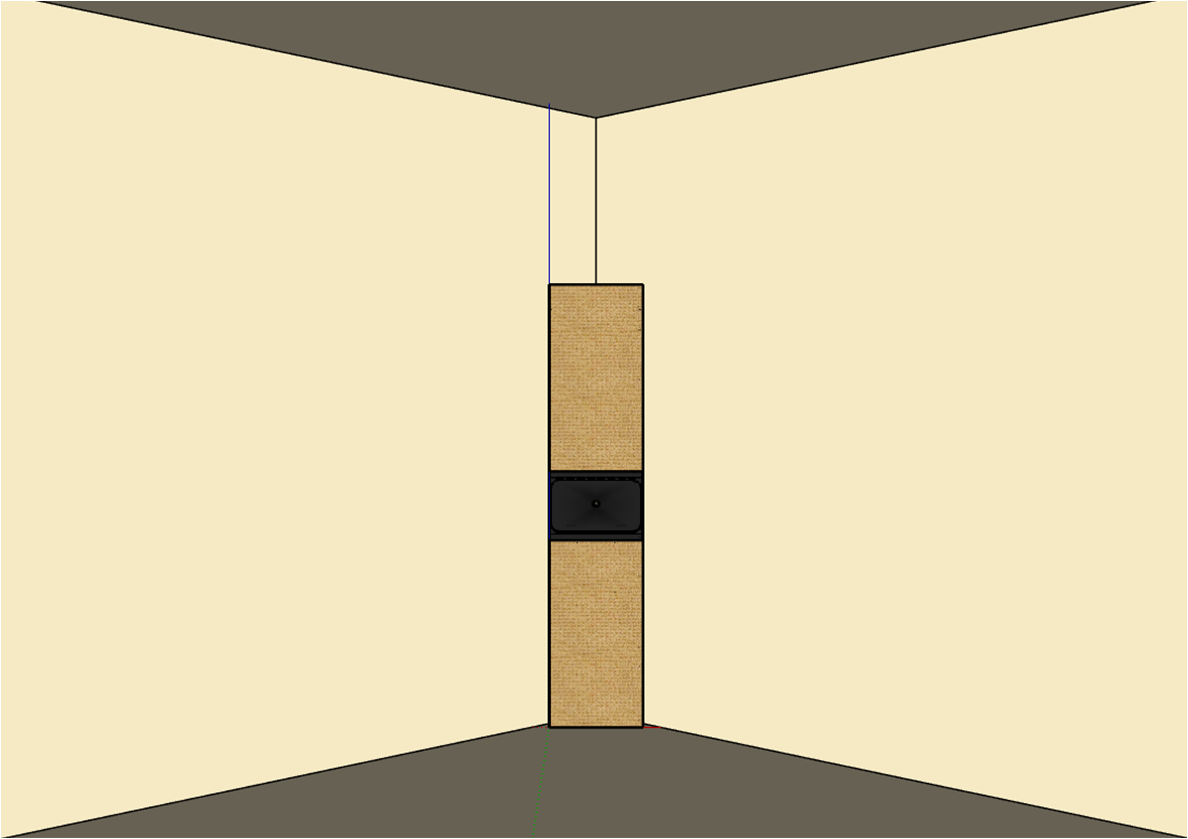
Ceiling height is 9' and viewing distance is 8'. The array is 1950mm x 412mm x180mm with a trapezoidal footprint. I'm hoping that with grill cloth matched to the wall color all one would see would be the waveguide.
Here is a view of the completed system design tucked away in a corner with the woofers behind grill cloth.
Ceiling height is 9' and viewing distance is 8'. The array is 1950mm x 412mm x180mm with a trapezoidal footprint. I'm hoping that with grill cloth matched to the wall color all one would see would be the waveguide.
Attachments
Sanity check: what if I replace the 5FE120 array with a TD15 at floor level?

The screenshot was taken with a driver offset of -600mm, representing standing listening at 3m distance. The response is fairly good around the seated position but falls apart at the XO between the rim slot array and the 15" woofer when you stand up.
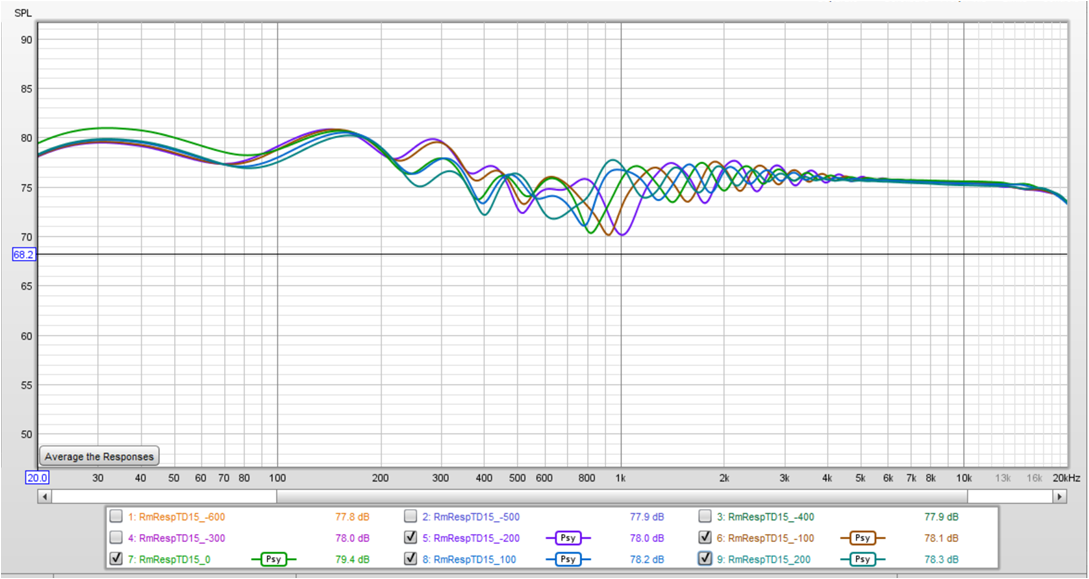
The variation with vertical offsets around seated shown above peaks at +/-3.5 db near 1 khz. This is about 2x what is seen with the 5FE120 array in place of the 15" woofer.
The screenshot was taken with a driver offset of -600mm, representing standing listening at 3m distance. The response is fairly good around the seated position but falls apart at the XO between the rim slot array and the 15" woofer when you stand up.
The variation with vertical offsets around seated shown above peaks at +/-3.5 db near 1 khz. This is about 2x what is seen with the 5FE120 array in place of the 15" woofer.
Attachments
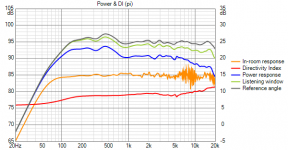
To me that last analysis proved that the extra complexity and height of the full 2m tall H-array was worthwhile. That being the case, how should it be equalized? This is what happens if the power response is equalized to a slowly falling target.

I should probably have a dip in the power response complementing the rise in the DI curve to flatten that axial peak....
I should probably have a dip in the power response complementing the rise in the DI curve to flatten that axial peak....
Attachments
I'd take the listening window as base. But actual DSP in room I'd base on single point measurements (just like with a full range array) seeing how close listening window is to Reference angle.
That's why I simulated my full range array with actual mirror copies acting as floor and ceiling mirror. That gave me a preview of what to expect in-room and determine a good way to target it with DSP tools (frequency dependent window based EQ plus some tweaks in my case).
That's why I simulated my full range array with actual mirror copies acting as floor and ceiling mirror. That gave me a preview of what to expect in-room and determine a good way to target it with DSP tools (frequency dependent window based EQ plus some tweaks in my case).
If you are measuring at the LP in room, then you are measuring room response by definition and have to "filter" the room out of the measurements by averaging and windowing. In simulation, the LW and axial and power responses are presented directly.
I'm wondering which of these responses should ideally be flat and looking for a high degree of correlation with them and the room response. Room response appears to match the power response if reflections are disabled in the room tab, with floor reflection having the largest effect. Perhaps this is why line arrays sound so good - they aren't affected by the floor.
I tried image arrays and dropped the practice early on because the sims were too loggy. I can't say if accuracy is better or not. What Vituix doesn't include is reflections of reflections. I tried to do that with image drivers and reflections enabled in the room tab and only succeeded in confusing myself.
I'm still looking at different configurations.
Here is a 4 way W M RimSlot WG RimSlot M W

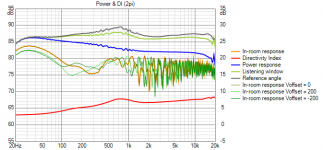
The room response overlays are for offsets of +/-200 mm and -600mm. Its incrementally better than the 3way with 16 of the 5FE120s as the 3rd way and it needs less room equalization.
But both those designs are trumped by my coarse frequency shaded SB65 line array - if you look solely at the room response curve
room response overlays are +/- 200 mm vertical offset
Here is a 4 way W M RimSlot WG RimSlot M W
The room response overlays are for offsets of +/-200 mm and -600mm. Its incrementally better than the 3way with 16 of the 5FE120s as the 3rd way and it needs less room equalization.
But both those designs are trumped by my coarse frequency shaded SB65 line array - if you look solely at the room response curve
room response overlays are +/- 200 mm vertical offset
Attachments

I tried image arrays and dropped the practice early on because the sims were too loggy. I can't say if accuracy is better or not. What Vituix doesn't include is reflections of reflections. I tried to do that with image drivers and reflections enabled in the room tab and only succeeded in confusing myself.
A simmed image array will give you a sneak peak of the IR one may expect. That's why it has been useful for me. Actually the latest Vituix versions were a lot less loggy to work with and learned me a couple of things when directly comparing them to my boat load of measurements. Very educational!
I won't use averaging in my near future. Single point corrections have had the upper hand to get the best sounding corrections. That doesn't mean I won't use control measurements at different points out in the room.
Basically, arrays do the averaging, for all practical purposes except... parallel planes to the arrays. Something I've said often and expect to say it many more times
") .
.I agree, this is the reason that EQ'ing speakers in a room without knowledge of their directivity can be problematic.I should probably have a dip in the power response complementing the rise in the DI curve to flatten that axial peak....
There was some interesting tips from kimmo on dealing with directivity mismatches through the cabinet, spacing and crossover. Trying some of these might help to ease the DI bump.
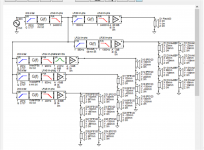
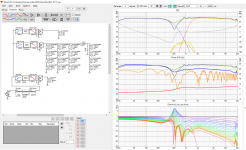
VituixCAD
I've been more or less doing the things Kimmo suggested - except for cabinet shape which is determined by its being a corner speaker. Since its tight in a padded corner nothing more than 45 degrees off axis matters. Most of the increments of improvement the last couple of weeks have been by playing with driver spacing - the width and vertical offset of the DMA45 array - and XO points and slopes and shading. There seems an irreducible DI rise/ power response dip circa 500 Hz which is likely due to the fact that that is where the floor reflection null would occur for a point source at array center.
But now I'm at a point where I must choose what to pursue. I'll simulate anything out of pure research interest/curiosity but reluctant to get my hands dirty without first seeing an audible payoff in those simulations.
I've taken another look at frequency shading my line array and rewiring/rebuilding that seems like a bigger return on a smaller investment than starting fresh with the waveguide + arrays. It has less response variation with height around seating and is less visibly/audibly influenced by the floor. Its main drawback is limited vertical window height which doesn't matter for seated listening.
The waveguide plus arrays has the cleaner top end after reflection combing is smoothed away. It has the most response variation between 500 Hz and 1 kHz (relative to the rest of the spectrum due to its inability to completely escape the floor's interference in this region) whereas the line array has the most variation above 10 Khz and loses treble almost completely at standing height. The waveguide has a usable horizontal beam more than twice as wide and doesn't need subs except to smooth out the room. If I had a home theater, I would certainly build a pair for it. For my office and living room and 90% seated listening, the more compact corner line array is better suited.
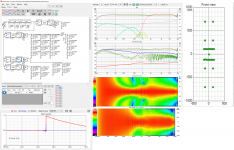
Here is the current state of my line array simulation
what I used to call coarse frequency shaded has been made finer by the incorporation of 4 inductors into the crossover to create 8 groups of 4 drivers.
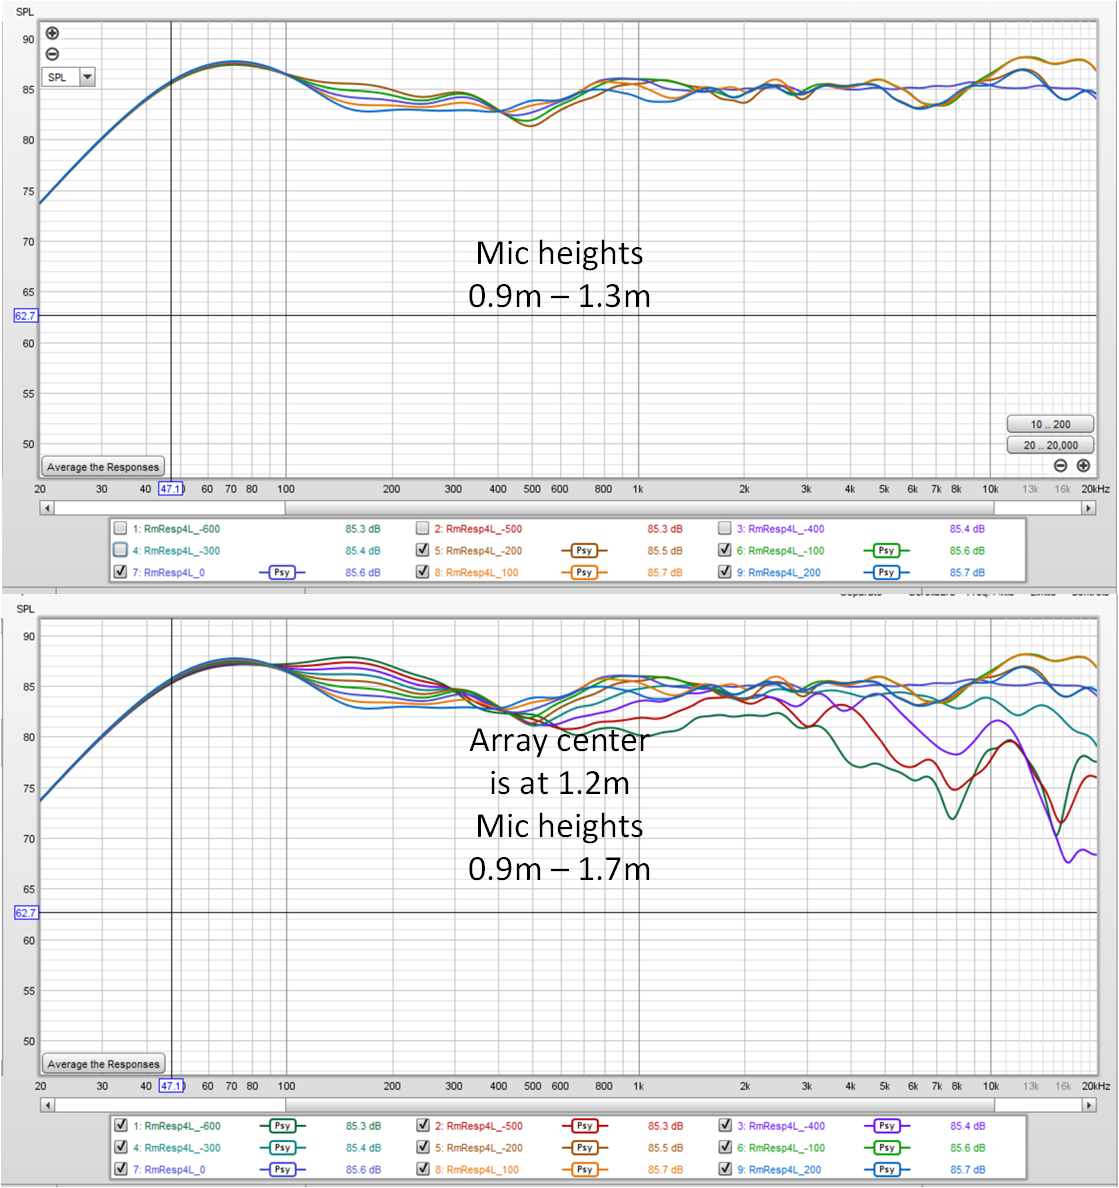
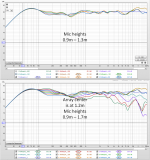
The room response overlays are for +/-200mm and -600mm offsets from center. More detailed response vs height
when room response is eqed to the average +/-200mm around center, this is what results on axis and in the power response:

what I used to call coarse frequency shaded has been made finer by the incorporation of 4 inductors into the crossover to create 8 groups of 4 drivers.
The room response overlays are for +/-200mm and -600mm offsets from center. More detailed response vs height
when room response is eqed to the average +/-200mm around center, this is what results on axis and in the power response:
Attachments

It's hard to argue that frequency shading a line you already have isn't the better bang for the buck.Here is the current state of my line array simulation
Is the DI dip between 2 and 7K a result of the shading? If it is then trying to smooth that out would be worthwhile, the elevation of the power response over that range is not ideal.
I believe that (small) DI elevation is due to the shading, a consequence of my latest changes adding the inductors and adjusting them to flatten the -5 degree line on the vertical line chart - a compromise I have no way of evaluating short of listening. At least I'm getting a feel for what affects what.
I believe if you'd allow a little more overlap, you'd be making the vertical beam a little wider. Overall leading to better/more consistent behavior over the area of interest, even though the on-axis would (probably) show a tiny bit of wiggling due to there being more interference overall.
In the end if the height variation is less, I'd still call it a win. At least, that has been my focus.
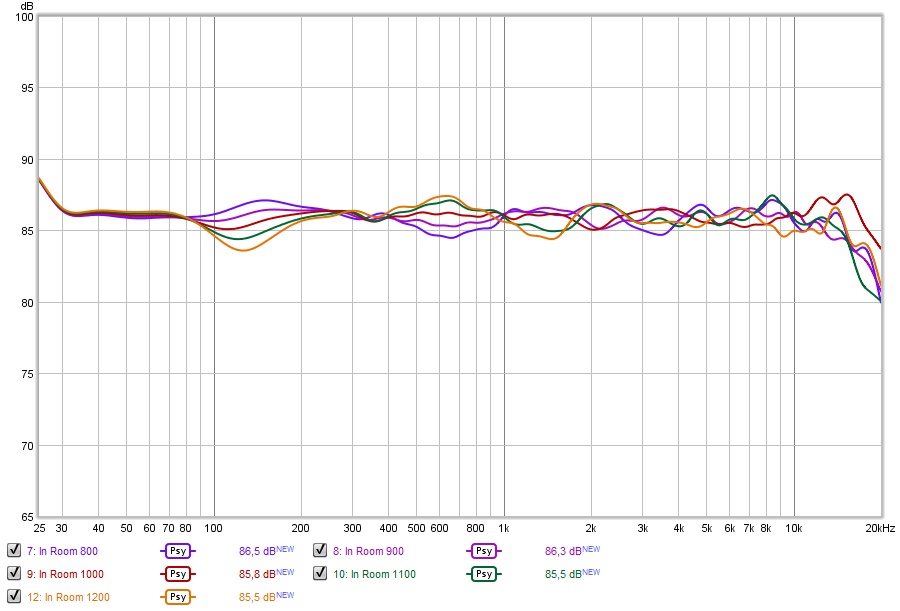
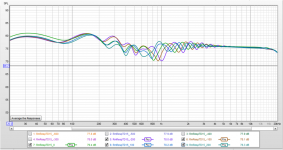
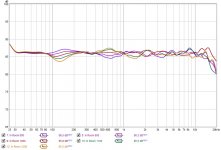
Psy smoothing used on a 40 cm height variation plot with 0 dB attenuation on floor and ceiling.
Do you have a plot of the unshaded 32 driver array to compare the two?
In the end if the height variation is less, I'd still call it a win. At least, that has been my focus.
Psy smoothing used on a 40 cm height variation plot with 0 dB attenuation on floor and ceiling.
Do you have a plot of the unshaded 32 driver array to compare the two?
Attachments
Last edited:
I'm sure more overlap would do exactly as you say; it did for you. I'm consciously optimizing for seated for use in my office where I will only listen seated. I was considering living room where multiple listening distances, some of them standing height, would apply. Simulating that, I found excessive variation with distance, something I had noticed very early in this thread, and something I just happened to read in a Kimmo post this AM.
I tried increasing overlap by changing my FIR low pass filters to 1st order and I like the result! The overlaps are the usual +/- 200 mm offset, plus one with floor and ceiling reflections disabled.

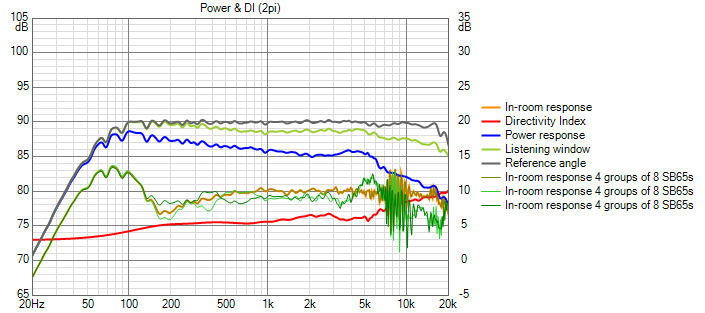
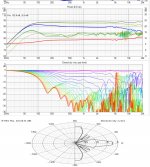
The rise in the power response seems immune to shading changes. Instead its correlated with the huge vertical sidelobes you see in the line and polar charts. Not surprisingly, the 66mm driver spacing is the wavelength of 5212 Hz.
The rise in the power response seems immune to shading changes. Instead its correlated with the huge vertical sidelobes you see in the line and polar charts. Not surprisingly, the 66mm driver spacing is the wavelength of 5212 Hz.
Attachments
- Home
- Loudspeakers
- Full Range
- Full range line array for wall or corner placement