I would like to increase the meshingto find that limit. It should keep improving the finer the mesh. I don't mind if these run overnight.
However, I can't go any finer in the Z direction in Sketchup because the minimum mesh size is given by the number of segments in the piecewise linear profile curve I extracted from the original STL. I think this and the STL output algorithm are already limiting the benefit from increasing the mesh frequency in ABEC.
Eventually I will get to the point where a small roundover is needed on the intersection of the port hole with the waveguide surface. And I'll want to learn how to increase mesh density only in the vicinity of the port holes.
Abec help suggests using .dae output from sketchup and then using meshlab to adjust the mesh. If that works, I can do tagging in the mesh. exploring, so far found that I need to scale the mesh in meshlab...
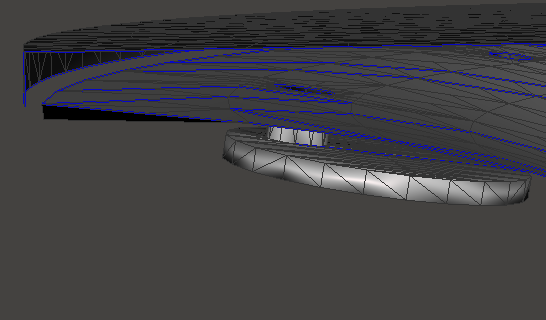
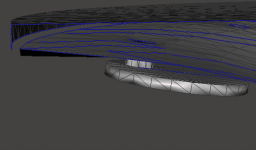
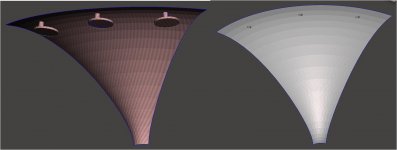
Here is the finer, apparently too fine re' sim time, mesh I'm getting using Collada output from sketchup.
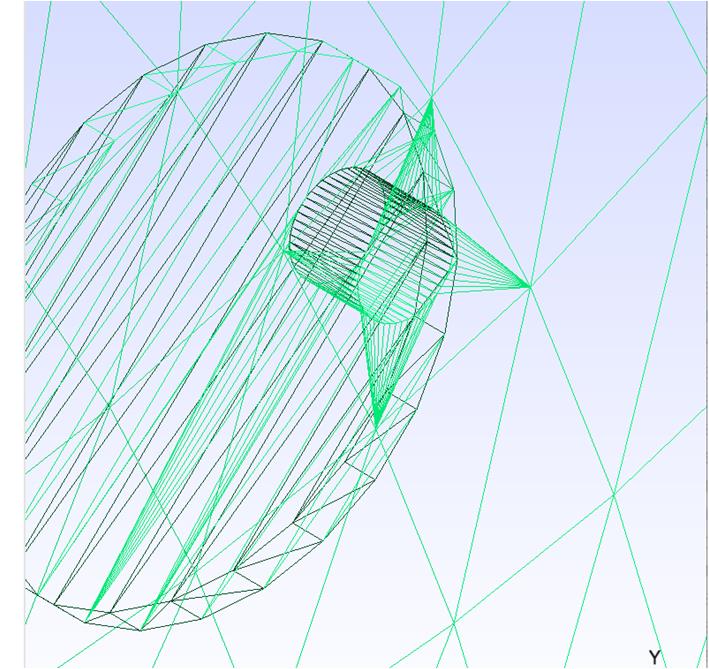
this mesh does resolve the port holes finely. there is no hope if that isn't good enough. You can see the underlying, original waveguide mesh in the background. All the port holes penetrate this mesh in a single ring of that mesh. Since that was good enough for the original waveguide to produce smooth results, that a finer wg mesh shouldn't be necessary to get smooth results for the wg with ports. I'm eager to see results from this meshing but it looks like the run will take hours...
this mesh does resolve the port holes finely. there is no hope if that isn't good enough. You can see the underlying, original waveguide mesh in the background. All the port holes penetrate this mesh in a single ring of that mesh. Since that was good enough for the original waveguide to produce smooth results, that a finer wg mesh shouldn't be necessary to get smooth results for the wg with ports. I'm eager to see results from this meshing but it looks like the run will take hours...
Attachments
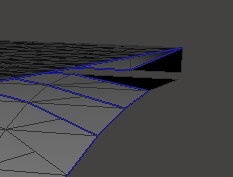
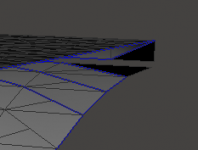
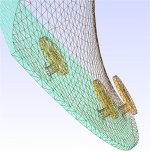
What matters is the edge length and whilst that mesh is smooth it is done with long thin triangles. Look at the difference between the port and the chamber edge. Look at mabat's meshing, divided vertically then horizontally to get the edge length desired.
If you can find a way to divide the triangles properly the element count will increase significantly.
There is a sort of limit around 10,000 elements where going above that can send ABEC into an almost endless loop of never finding a solution.
You cannot just keep throwing resources at it and brute force an answer beyond a certain point.
What I have done before is to scale the model down to reduce the CPU time and keep elements under control while investigating options, the difficulty here is your ports are already very small compared to the guide size.
The ports being relatively small is both a blessing and a curse; a blessing because it means they might be acoustically transparent; a curse because they are hard to model/mesh.
The run with the long thin triangles just completed after 8 hours and the results were not as good as before. but at least I know the path via collada export which supports tagging and hierarchy works
I will need to do some kind of hierarchical meshing to force finer resolution around the ports where its needed.
redrew the port intersections to minimize number of long skinny triangles and ABEC is now working on it.

I can tell its going to be a long run because its been stuck at 16% for a while
meshing=delaunay, mesh frequency = 4000 perhaps they don't need to be set there for this initial mesh but I am going to be out and about today so it may as well run...
I can tell its going to be a long run because its been stuck at 16% for a while
meshing=delaunay, mesh frequency = 4000 perhaps they don't need to be set there for this initial mesh but I am going to be out and about today so it may as well run...
Attachments
Last edited:
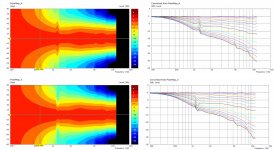
after almost 5 hours I get these results:
I'm pretty happy with these results. Pre-ATH, I would have been ecstatic for this performance from a waveguide without mid port holes. Marcel has spoiled us!
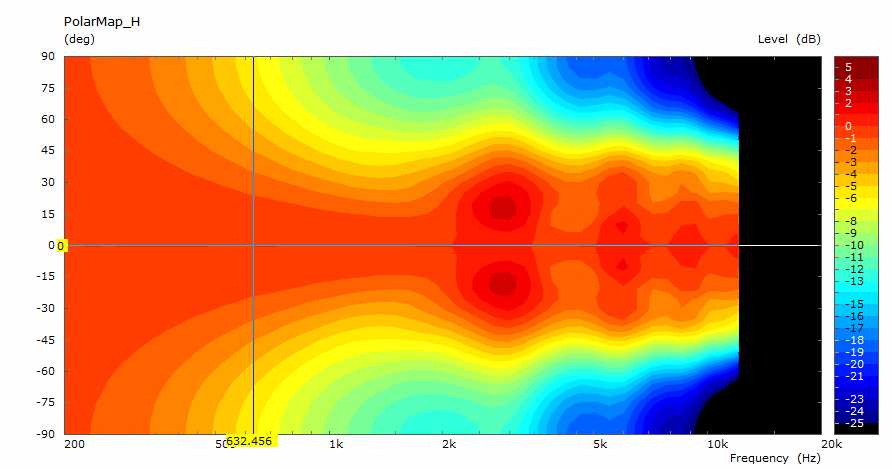
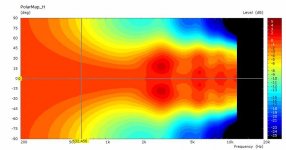
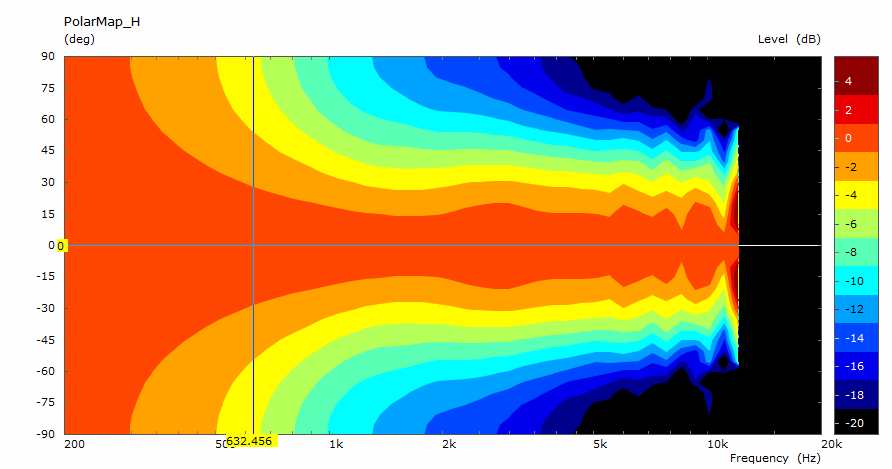
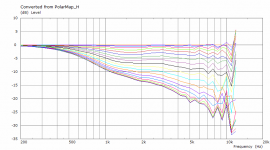
If the dark spots at 3 khz and the narrowing at 4 khz are due to the mid port holes, there is a +/- 10 degree window free from their effects. Outside this window, the effects are smal,l as can be see looking at a higher resolution polar color map (1db per color shade)
Still, before I'm done I want to simulate with perhaps twice the number of smaller holes for the same total hole area.
I'm pretty happy with these results. Pre-ATH, I would have been ecstatic for this performance from a waveguide without mid port holes. Marcel has spoiled us!
If the dark spots at 3 khz and the narrowing at 4 khz are due to the mid port holes, there is a +/- 10 degree window free from their effects. Outside this window, the effects are smal,l as can be see looking at a higher resolution polar color map (1db per color shade)
Still, before I'm done I want to simulate with perhaps twice the number of smaller holes for the same total hole area.
Attachments
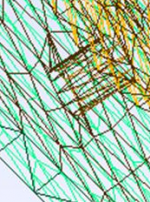
That looks much more reliable from a simulation stand point but I'm surprised it has caused so much damage. I still see a few potential issues with how the mesh goes together but without recreating it myself it's hard to say if they matter.
There is a 90 degree window for their effect, it's not a hot spot when the rest of the graph moves out with it.
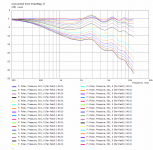
To get the polar curve graphs select the polar graph and from the graph menu select Convert curves <-> Contour. That will make it easier to see.
Also right click on the graphs and select export as picture and use the png option, for some reason this makes them much clearer when posted to the forum.
There is a 90 degree window for their effect, it's not a hot spot when the rest of the graph moves out with it.
To get the polar curve graphs select the polar graph and from the graph menu select Convert curves <-> Contour. That will make it easier to see.
Also right click on the graphs and select export as picture and use the png option, for some reason this makes them much clearer when posted to the forum.
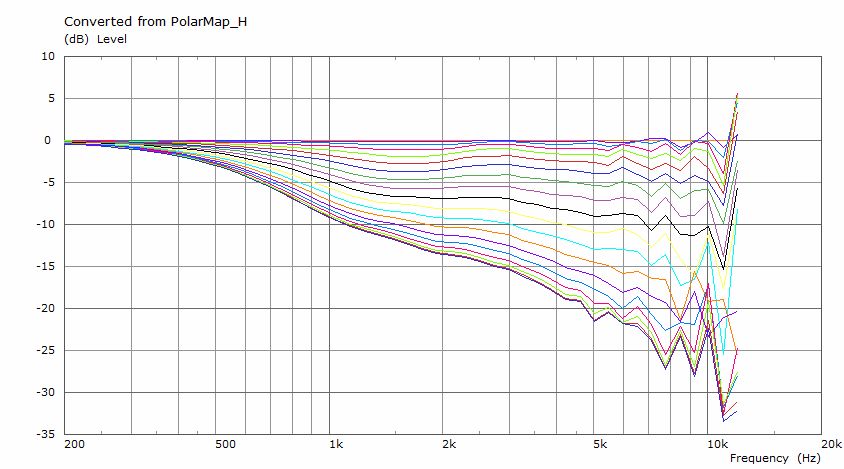
Normalized polar data viewed in a different way. You can see the three resonances that affect almost all angles. See how they overtake the on axis and near axis plots. Dips off axis are not that audible, peaks off axis are a problem. ABEC will make these worse than they will be in reality because the driver won't be a rigid boundary but it does show where the issue will show up.
the three look harmonically related. the frequencies of the peaks are not related to the hole size or their distance from apex nor to calculate helmholtz resonance
at 3 khz the off axis rises about 5db which could well be problematic if it comes back as a colored reflection. That may not happen; the curves that rise above on-axis are only circa 20 degrees off axis
wish the legends gave the off-axis angles...
at 3 khz the off axis rises about 5db which could well be problematic if it comes back as a colored reflection. That may not happen; the curves that rise above on-axis are only circa 20 degrees off axis
wish the legends gave the off-axis angles...
one more time around the loop
I revised the cad dwg to prepare it for drive elements in the chambers, hand meshing the top and bottom of the chambers to avoid possibly problematic long skinny triangles and separating out what would proxy for the driver cone as a separate component/group on its own layer. Before doing that I ran the simulation with the CD driving to see if results changed - and they did. The resonances disappeared and simulation time reduced to 1 hour.
here is the cad drawing whose stl was given to abec. This time I gave exported stl directly to abec instead of exporting dae and then going through meshlab. This may be the more significant change; I have to rescale the mesh in meshlab and I had it do repairs, which may not have been a good idea.

the mesh exported from abec is attached; I don't yet have a good viewer because my stl importer won't work on these meshes.
Here are the simulation results
The question I'm left with is which of the last 2 simulations is more accurate/trustworthy. I will have to go through the DAE path once more to find out. You know which one I want to trust")
I revised the cad dwg to prepare it for drive elements in the chambers, hand meshing the top and bottom of the chambers to avoid possibly problematic long skinny triangles and separating out what would proxy for the driver cone as a separate component/group on its own layer. Before doing that I ran the simulation with the CD driving to see if results changed - and they did. The resonances disappeared and simulation time reduced to 1 hour.
here is the cad drawing whose stl was given to abec. This time I gave exported stl directly to abec instead of exporting dae and then going through meshlab. This may be the more significant change; I have to rescale the mesh in meshlab and I had it do repairs, which may not have been a good idea.
the mesh exported from abec is attached; I don't yet have a good viewer because my stl importer won't work on these meshes.
Here are the simulation results
The question I'm left with is which of the last 2 simulations is more accurate/trustworthy. I will have to go through the DAE path once more to find out. You know which one I want to trust
Attachments

Quite possibly neither is reliable they are quite different from each other which is troubling.
I use Meshmixer as an STL viewer. I can see a few weird things with the last mesh you attached.
Here there seems to be a gap between the interface and the waveguide
Here it looks like there is another surface overlaid on the waveguide shown in blue and some of the triangles have the normals pointing the wrong way
Attachments
thanks for finding that!
I have meshmixer and gmsh too but I didn't look closely enough and didn't trust meshmixer. I had been using a free trial of an stl importer that allows me to dissect the stl but that ran ought and when I purchased it there was a problem with the license file still not fixed.
I'm going to have to back up a couple of revisions and then go forward again with the interface still attached...I think I lost that last little edge piece of the waveguide by running a cleanup plugin with the interface hidden
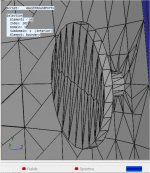
after way too many iterations, I finally got abec to export a mesh that even MeshMixer seemed to like:
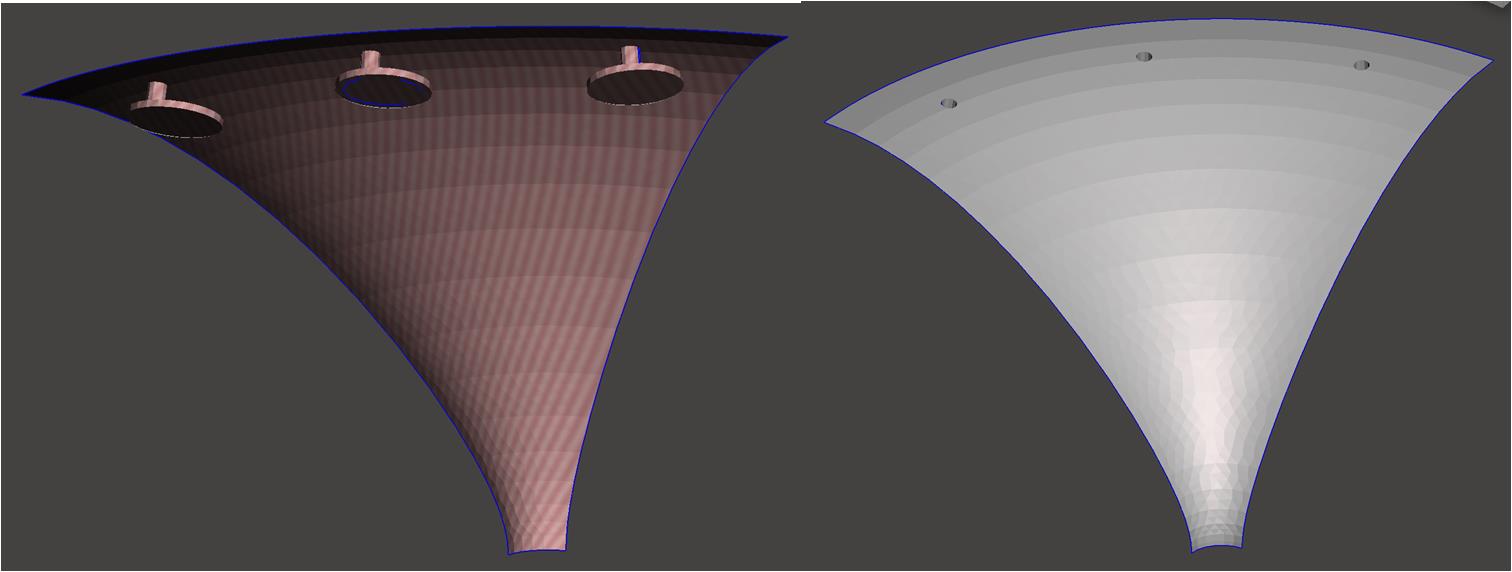
The same mesh from a different angle in gmsh:

what made this process painful was that I was inadvertently flipping normals on faces affected by my editing to clean up the waveguide port penetrations and meshing. When I finally thought to ask, google told my how to check normals in sketchup, previously I only knew how to flip them.
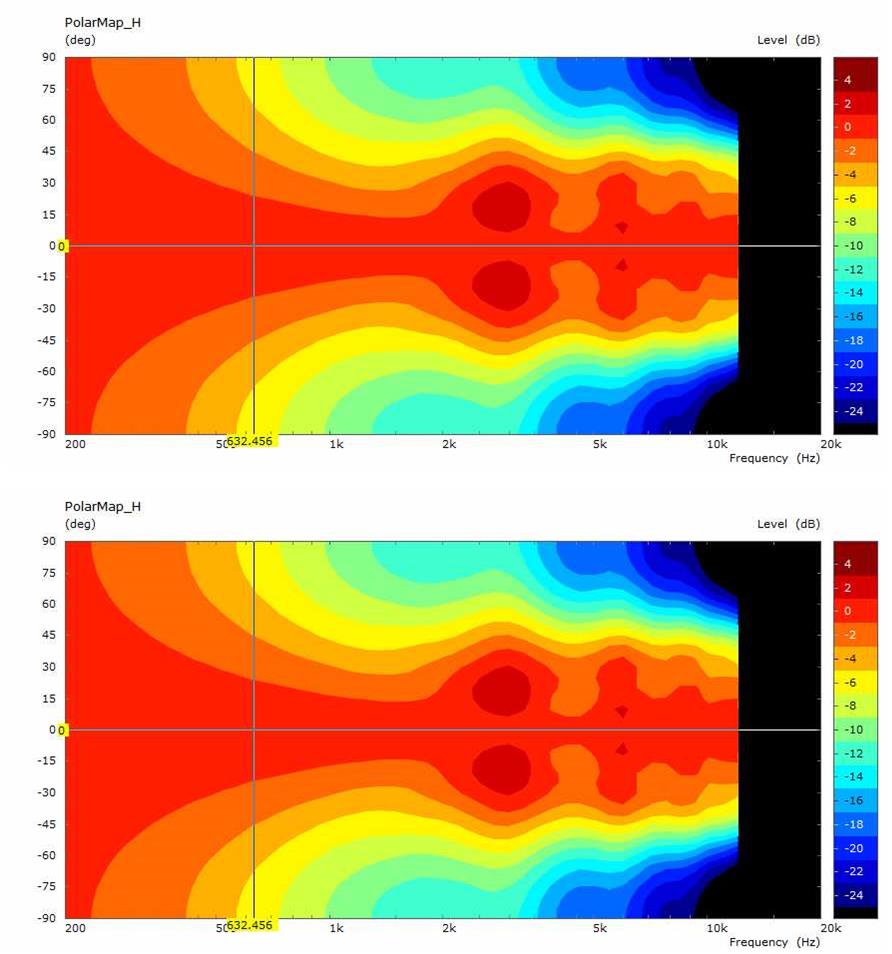
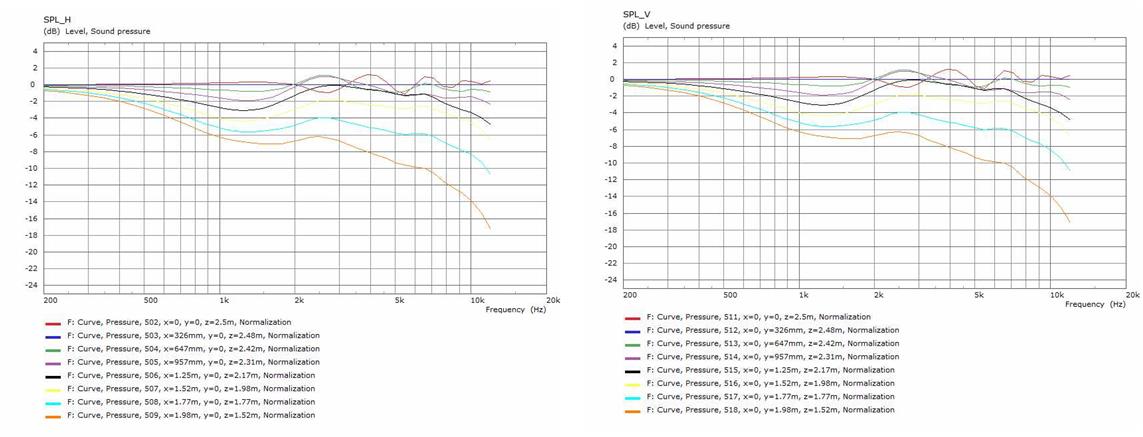
The final graph is composite of abec results. A 2.3 hr run with mesh frequency = 4000, 48 frequencies
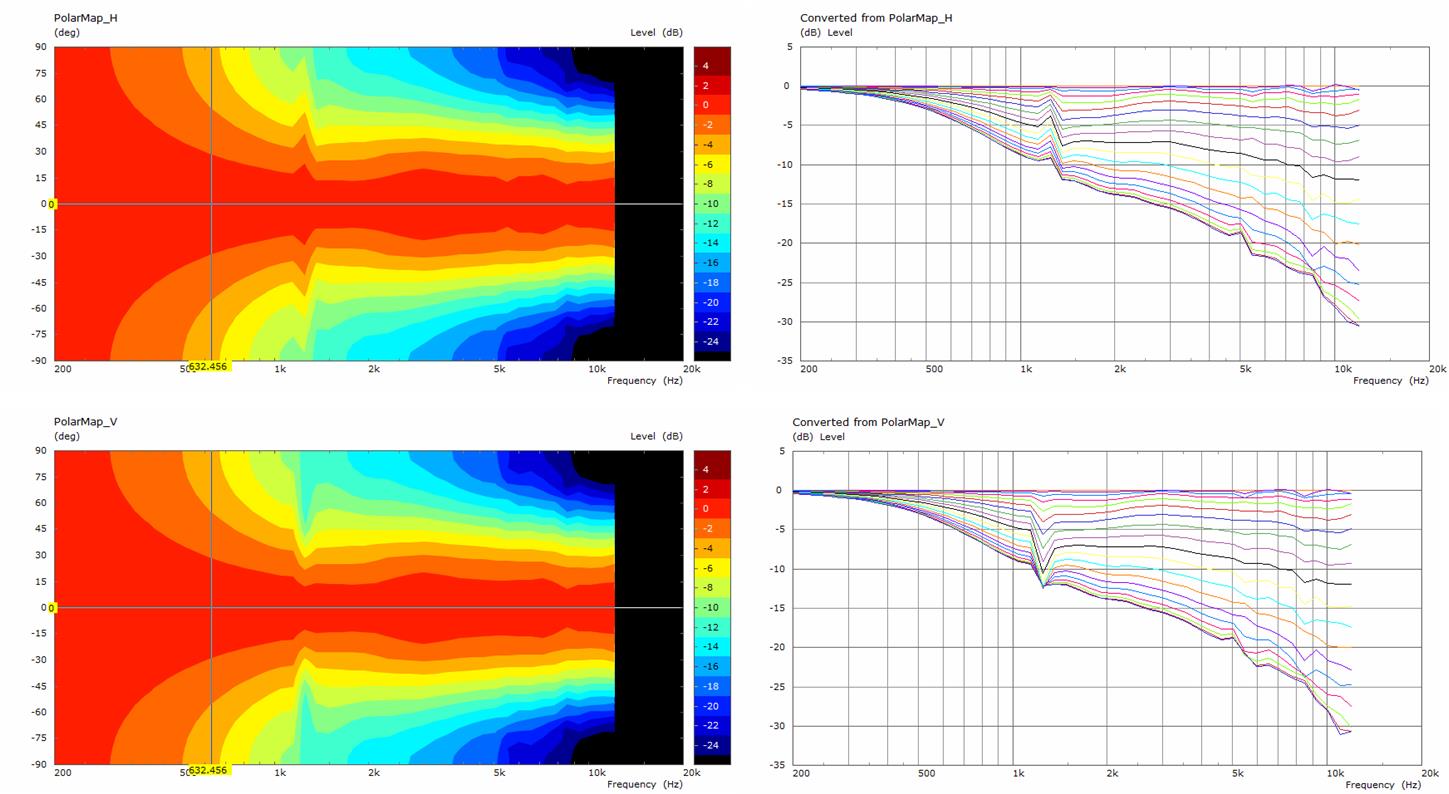
Its incredibly good on axis, but so was the original waveguide. Incredible is synonymous with unbelievable. Should I believe these results? The mesh looks good. The results don't show signs of meshing that is too coarse.
Its puzzling why an axisymmetric waveguide penetrated by ports placed symmetrically with respect to x and y axis should have different results off axis and that those differences should be complementary with H peaking where V is dipping.
The same mesh from a different angle in gmsh:
what made this process painful was that I was inadvertently flipping normals on faces affected by my editing to clean up the waveguide port penetrations and meshing. When I finally thought to ask, google told my how to check normals in sketchup, previously I only knew how to flip them.
The final graph is composite of abec results. A 2.3 hr run with mesh frequency = 4000, 48 frequencies
Its incredibly good on axis, but so was the original waveguide. Incredible is synonymous with unbelievable. Should I believe these results? The mesh looks good. The results don't show signs of meshing that is too coarse.
Its puzzling why an axisymmetric waveguide penetrated by ports placed symmetrically with respect to x and y axis should have different results off axis and that those differences should be complementary with H peaking where V is dipping.
Attachments
Overall it does seem that the added ports are small enough to not play a big role here.
I bet real life measurements would look even better.
It's pretty directional in the horizontal (same as vertical) so it will avoid a lot of indirect energy from the room.
That difference between up and down in H/V sure is strange...
I bet real life measurements would look even better.
It's pretty directional in the horizontal (same as vertical) so it will avoid a lot of indirect energy from the room.
That difference between up and down in H/V sure is strange...
These results are the most convincing yet. The 1K glitch is a numerical issue. You can try adding NUC=True to the solving txt, that can sometimes help. Changing the range of solving frequencies can stop it landing on something where there is an issue too.Its incredibly good on axis, but so was the original waveguide. Incredible is synonymous with unbelievable. Should I believe these results? The mesh looks good. The results don't show signs of meshing that is too coarse.
Its puzzling why an axisymmetric waveguide penetrated by ports placed symmetrically with respect to x and y axis should have different results off axis and that those differences should be complementary with H peaking where V is dipping.
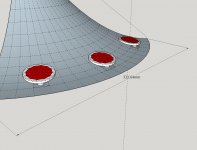
The mesh in general looks much better. One thing that I see is that the vertices of the ports do not meet the triangles of the waveguide exactly and are not the same at each location. See how there are triangles going off from the ports at the top but not at the left.
The outline of the port should "cut" the waveguide. I will usually extrude a cut through the waveguide and then loft a surface from the port bottom to the waveguide to create the port surface.
Attachments
- Home
- Loudspeakers
- Full Range
- Full range line array for wall or corner placement