After cutting a batch of Frugel-Horn cabinets for Custom Cans, I thought I'd have a play around making some bookshelf speaker cabinets for some full range drivers.
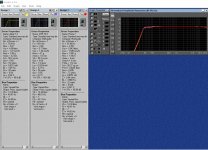
I have just started using a very simple speaker simulator called Bass Box 6. After loading in parameters for 3 Mark Audio drivers: Aplair 7.3, CHR 70.3 and Pluvia 7 I am seeing very similar frequency response curves. I have attached a screen shot.
Could anyone shed any light on this, are the drivers so similar this simulation is accurate? For a an enthusiastic novice looking to experiment with a few cabinet designs, what criteria should be used to decern between these (or other) drivers?
Attachments
")
Could anyone shed any light on this, are the drivers so similar this simulation is accurate?
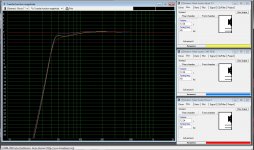
Appears to be similar to WinISD, maybe slightly less accurate.
BTW, WinISD uses a QB3 alignment, don't know anything about BB6.
jeff
Attachments
Last edited:
Bass Box 6 is actually quite a decent piece of software for modelling sealed & reflex enclosures and is similar to WinISD -has a couple of features the latter does not have, and visa versa. Incidentally Jeff, WinISD offers a QB3 alignment amongst others (as does BB6) with full ability for the user to change the alignment / box volume / tuning / damping as they see fit, so they're reasonably flexible within broad limits.
Reverting back to the OP, the box alignments come out fairly similar because those drivers have similar baseline electromechanical characteristics (as set out in the T/S parameters). As a rule, maximally flat alignments are best avoided as room-gain will lift the LF excessively so what looks flat under anechoic conditions will be anything but if the speaker is placed anywhere near a wall or walls. As noted, these are merely simulations of the enclosure behaviour when loaded by one of those drivers; it is not a simulation of the speaker as a whole.
Reverting back to the OP, the box alignments come out fairly similar because those drivers have similar baseline electromechanical characteristics (as set out in the T/S parameters). As a rule, maximally flat alignments are best avoided as room-gain will lift the LF excessively so what looks flat under anechoic conditions will be anything but if the speaker is placed anywhere near a wall or walls. As noted, these are merely simulations of the enclosure behaviour when loaded by one of those drivers; it is not a simulation of the speaker as a whole.
Thanks for the responses. Cheers Jeff for taking the time to model the drivers in WinISD, seems to corroborate the BB6 graphs.
I mistakenly thought that the drivers in the BB6 database included frequency response data, which is why I was confused at the similarity. As the frequency data is not included the graphs reflect the TS parameters of the drivers, which in this case are similar in character.
I can see that BB6 will be useful for simulating box parameters for a given driver, but at this stage I was hoping to utilise it as a tool to offer an objective comparison of various drivers. I don't find it clear comparing frequency response graphs between drivers, even between the MA drivers the graphs have not been normalised. Then looking at other manufactuerers graphs with different scaling and plotting styles, I find it difficult to compare frequency response deviations. To me the Pluvia 7 frequency response appears flatter than the alpair 7.3, but the plotting is different and I think the less dense data set gives the impression that the peaks and troughs are mellower.
Is there an online source for frequency response data? I would really like to plot various drivers in a single graph for clear comparison.
So what you are modeling with the curve you are looking at there is a filter. It shows you how the driver reacts in the box size you have been given and how the bass is basically high passed by the box, so you can see the fall off. You would need to take acoustic measurements to see the final result. Give or take the fr you see in the graphs would follow the curve you see in your model. Of course there are other things like baffle step and diffraction that affect the final result. All you are doing here really is getting an idea with direction a given box size or aligment is taking you.
Did you get my PM?
Strfan
Did you get my PM?
Strfan
- Status
- This old topic is closed. If you want to reopen this topic, contact a moderator using the "Report Post" button.
- Home
- Loudspeakers
- Full Range
- Help choosing drivers please