Those lines are so close together, how could they possibly sound different??
jn
In the mid Audio area the two are more than a factor 15 apart.
That’s not very close IMO, so the Zip Cord doesn’t match the speaker impedance at all.
But then again, I still don’t know wheter reflections are the cause of the sound difference, but I simply have no other explanation.
Hans
Thanks for that. That network analyzer chart will need some explaining to us audio folk. Why is the impedance below 1 kHz so high? Does this have to do with SQRT (Zopen*Zshort) ?
Think of the cable as an inductor in series and a cap between the conductors.
Below 1Khz for an open ended cable the cap has an impedance 1/(jwC), so the lower the frequency, the higher the Impedance.
With the ends shorted, you are looking into an inductor with Impedance jwL, so the lower frequency, the lower the impedance up to the cable’s DC resistance.
So the shortened impedance stops below a certain frequency, while the
open ended version keeps going up.
So Sqrt(Zo*Zs) keeps going up when frequency goes down below a certain frequency.
Hans
In the mid Audio area the two are more than a factor 15 apart.
That’s not very close IMO, so the Zip Cord doesn’t match the speaker impedance at all.
But then again, I still don’t know wheter reflections are the cause of the sound difference, but I simply have no other explanation.
Hans
I must apologize, that was a tongue in cheek attempt at humor. Either it doesn't translate across the pond, or my attempt at humor was dismal.
My guess is the latter...
")
The difference is quite large.
jn
Edit...it's not actually the reflections...it is the fact that the reflections are how the speaker wire charges up. Until the reflections have settled down the load current is not what the amplifier wants it to be.
It is interesting seeing those who discard the t line reflection, thinking that the line just...passes the information on at prop velocity. They don't understand that that thinking violates the speed of light.
Last edited:
Because you need to measure the Z at each frequency. And at low audio frequencies, Zopen will be very, very high and Zshort will be very, very low.Thanks for that. That network analyzer chart will need some explaining to us audio folk. Why is the impedance below 1 kHz so high? Does this have to do with SQRT (Zopen*Zshort) ?
 Of course that makes plenty sense, but what I don't understand is a graph that seems to show speaker cables with 30-60 ohm impedance at low audio frequencies. What am I misreading there?
The cable’s Zo impedance at a certain frequency is the characteristic impedance, meaning that no reflection comes back when terminated with this resistance at this frequency.
Don’t get the impression that it is an impedance in series with the speaker.
I hope I didn’t confuse you with my measurements, because I’m still anxiously looking forward at your findings.
Hans
Don’t get the impression that it is an impedance in series with the speaker.
I hope I didn’t confuse you with my measurements, because I’m still anxiously looking forward at your findings.
Hans
From Audio Engineering Society Fellow Jim Brown:
"Transmission Lines at Audio Frequencies, and a Bit of History"
http://www.audiosystemsgroup.com/TransLines-LowFreq.pdf
"Transmission Lines at Audio Frequencies, and a Bit of History"
http://www.audiosystemsgroup.com/TransLines-LowFreq.pdf
Thank you Hans for the measurements and the formulae.Basically a VNA puts a resistor R in series with a the DUT with impedance Z.
When…
May I ask what is the resistor value that your VNA places in series with the DUT and what model your VNA is?
George
Yes George, by all means.Thank you Hans for the measurements and the formulae.
May I ask what is the resistor value that your VNA places in series with the DUT and what model your VNA is?
George
It's the same gear that I used for measuring those Carts some time ago.
For those Carts I used a 5K resistor and now for the cables a 100R ultra low inductance Johanson resistor.
Hardware is my 100Mhz programmable Picoscope 5243B, with an inbuilt generator that goes to 20Mhz with output voltages up to 1.4Vrms.
Software used is FRA4PS, see
Frequency Response Analyzer with Bode Plots
With a second program FRA Imp Viewer, I can import the generated bode plot and unravel everything in Impedance, inductance and Capacity versus frequency.
https://www.eevblog.com/forum/testg...bode-plot-data/?action=dlattach;attach=719919
Hans
Thank you Hans
I run the FRA Imp Viewer but I don't see that I can import .csv or .txt files into it.
I guess the formulae are here
LCR Impedance Viewer for Picoscope+Keysight+R&S Bode Plot Data (open source) - Page 2
LCR Impedance Viewer for Picoscope+Keysight+R&S Bode Plot Data (open source) - Page 2
I had tried to do it myself in excel but I gave up. (all good up to the point of cal for open and short)
George
I run the FRA Imp Viewer but I don't see that I can import .csv or .txt files into it.
I guess the formulae are here
LCR Impedance Viewer for Picoscope+Keysight+R&S Bode Plot Data (open source) - Page 2
LCR Impedance Viewer for Picoscope+Keysight+R&S Bode Plot Data (open source) - Page 2
I had tried to do it myself in excel but I gave up. (all good up to the point of cal for open and short
)George
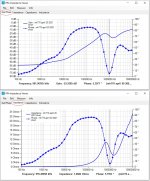
FRA4PS can export .csv files with resp. Freq Log (Hz), Gain(dB) and Phase (deg).
These .csv files can be directly read in FRA Imp Viewer.
See example below for a .csv generated file by FRA4S and importable by FRA Imp Viewer as an FRA4Picoscope file with the `NEW` button.
Enter 100R as series resistance.
Let me know if you need any further assistance.
Hans
.
These .csv files can be directly read in FRA Imp Viewer.
See example below for a .csv generated file by FRA4S and importable by FRA Imp Viewer as an FRA4Picoscope file with the `NEW` button.
Enter 100R as series resistance.
Let me know if you need any further assistance.
Hans
.
Attachments
Last edited:
You don´t have to go through those postings as you obviously did.Thank you Hans
I run the FRA Imp Viewer but I don't see that I can import .csv or .txt files into it.
I guess the formulae are here
LCR Impedance Viewer for Picoscope+Keysight+R&S Bode Plot Data (open source) - Page 2
LCR Impedance Viewer for Picoscope+Keysight+R&S Bode Plot Data (open source) - Page 2
I had tried to do it myself in excel but I gave up. (all good up to the point of cal for open and short
George
Just load the .Zip link I gave you and unzip them.
https://www.eevblog.com/forum/testg...bode-plot-data/?action=dlattach;attach=719919
Hans
Hi Hans
Apologies for not responding so far.
I try to think of ways to make use of imported V1, V2 data from a soundcard taken using the std impedance jig
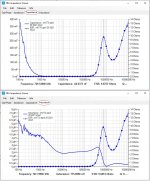
The SW works fine with your test file (Log Freq, Gain, phase), see attachments (Question. What is it that you have measured there?)
George
Apologies for not responding so far.
I try to think of ways to make use of imported V1, V2 data from a soundcard taken using the std impedance jig
The SW works fine with your test file (Log Freq, Gain, phase), see attachments (Question. What is it that you have measured there?)
George
Attachments
Glad to hear you got it working.
The file I sent you was the shorted LS line that I showed in orange in this posting
Zip cord for speaker test
Difference is that Imp Viewer has a linear vertical scale versus the log scale that I used.
Succes wit this tool. As long as you offer a .csv file in the right format, you can use it for anything else as long as the series resistor is connected to the source and the DUT between the resistor and gnd.
The topology you once used with a virtual gnd connection will need different algorithms.
Hans
P.s. Have you seen that when moving the cursor over the image, the line below the image tells you exactly the details in the image. Very helpful.
Last edited:
- Home
- General Interest
- Everything Else
- Zip cord for speaker test